Read the statement by Michael Teeuw here.
MMM-COVID19-SPARKLINE
-
Description:
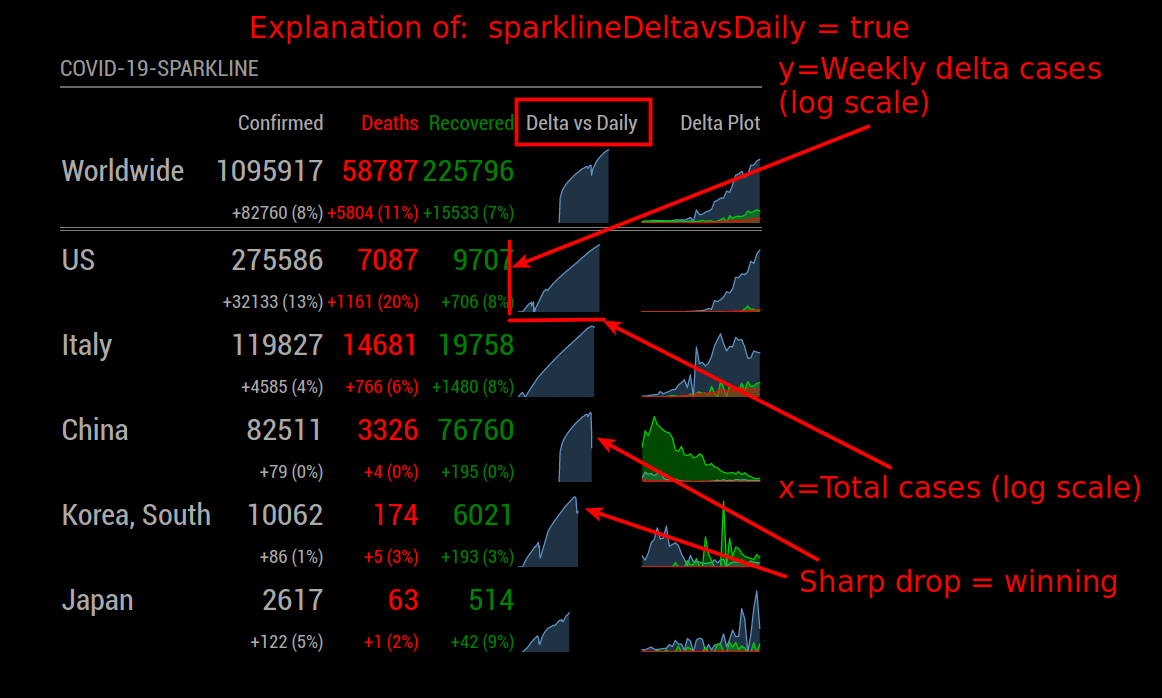
Yet another COVID-19 tracker. This one adds sparklines (small graphs).4-April-2020: Added Weekly change vs. Total Cases plot (
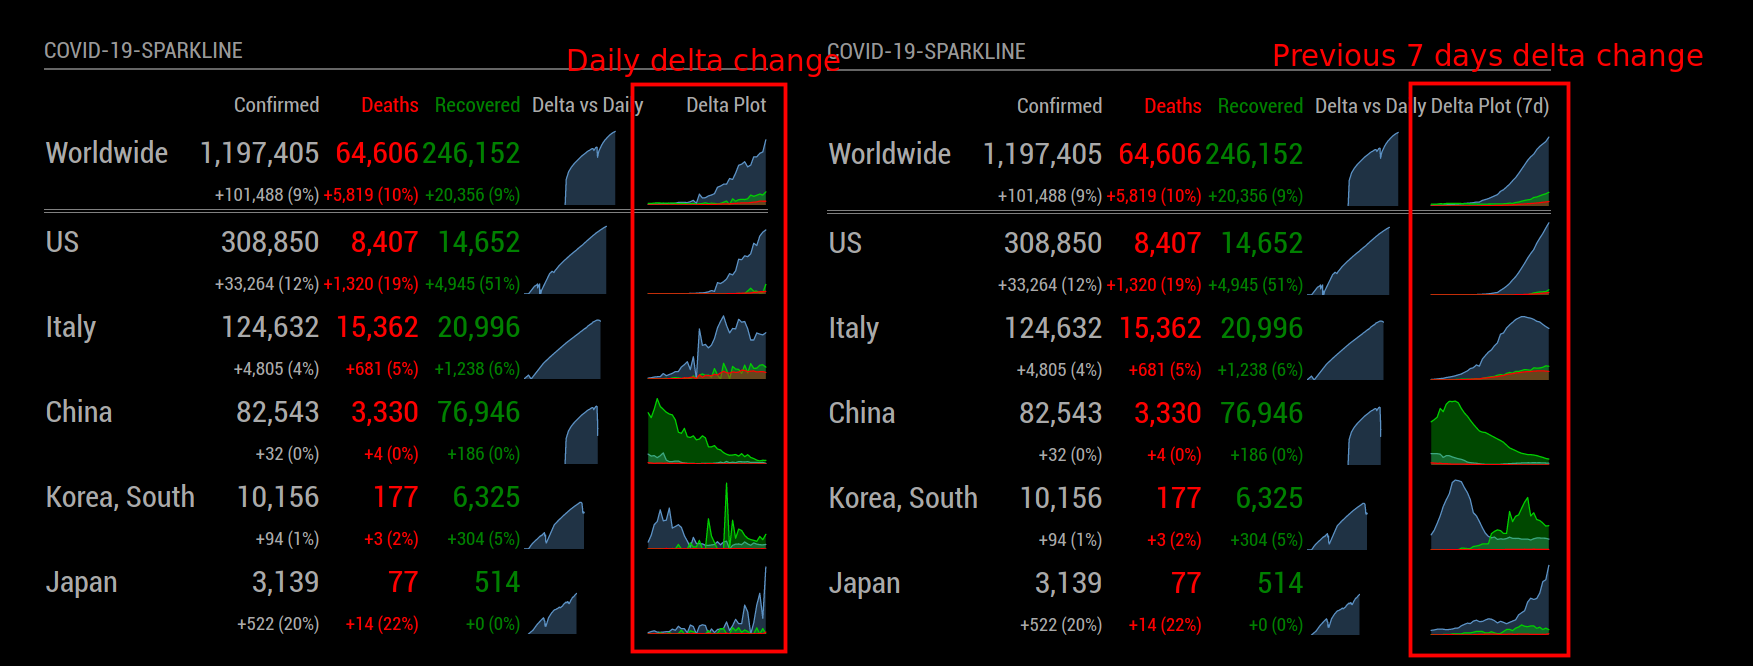
sparklineDeltavsDaily), see this idea put forth by minutephysics in “https://www.youtube.com/watch?v=54XLXg4fYsc”5-April-2020: Added ability to show n days in delta plot (
showDeltaPlotNDays), also merged Brian Hepler’s numeric delimiter option.For the latest info please see the project readme.md file.
Credits:
This is a combination of MMM-COVID19 and MMM-COVID-19. I liked Jose’s clean look, but I liked how Sean used the github data source (the same data Johns Hopkins is using). So I used Sean’s library and Jose’s GUI and added the tiny plots.I also discovered highcharts.js while working on this; this is an incredible piece of work. (Also see MMM-GoogleFit’s use of this lib.)
Thanks Brian Hepler for adding delimiters to the data, makes it much easier to read. See option
showDelimiter.Source:
I’m not a web developer.
https://github.com/skelliam/MMM-COVID19-SPARKLINEDevelopment:
If you see something wrong, please fix it and make a pull request. I can’t promise that I’ll be actively maintaining this or responding to queries.Screenshot:
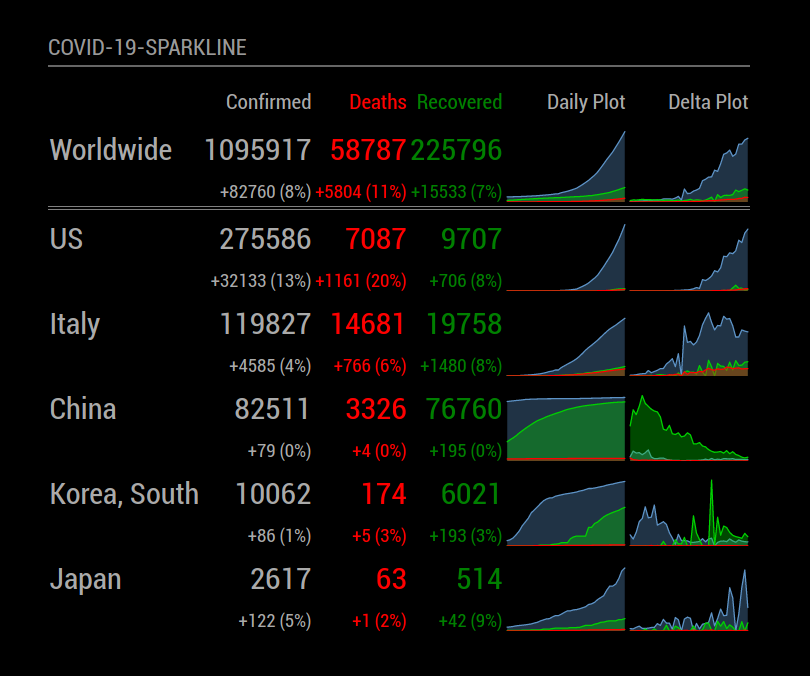
Delta Cases vs Total Cases Screenshot:
See optionsparklineDeltavsDaily.
Last n days in delta plot screenshot
The optionshowDeltaPlotNDayswill sum the previous (n) days and smooth out the delta plot, this has an effect of phase-shifting the data to the left in time, but it also helps eliminate noise. I love how the South Korea data below clearly shows two distinct curves – one indicating that their peak growth has come and gone, but a new curve showing peak growth of recoveries. This data is beautiful! :)
-
WoW! Fantastic ;)
-
Please add an option to select backend data. Current github api doesn’t have updated data for Europe. Using MMM-COVID19 data is refreshed.
-
uau, good work
-
This post is deleted! -
Thank you for this. Great work.
-
Is there any update to show UK / Europe data?
-
@Sparkie579 - UK can be specified by putting “United Kingdom” in the config. I don’t think there is one for the EU as a whole. But you can specify the countries in the EU.
You can go to the Johns Hopkins page and see the list of countries that it tracks. Use those names in the left column if you need to look up particular spelling & variations (UK vs United Kingdom vs Britain vs England).
-
@bhepler Thanks, that is exactly correct! Any country can be specified so long as it is in the Johns Hopkins data.
-
Getting this error when I try to run npm install
npm ERR! code Z_DATA_ERROR
npm ERR! errno -3
npm ERR! zlib: invalid distance too far backActually getting that error when trying to install MMM-Screencast as well.
Running my MM in serveronly in a docker on my Synology NAS
