A New Chapter for MagicMirror: The Community Takes the Lead
Read the statement by Michael Teeuw here.
Read the statement by Michael Teeuw here.
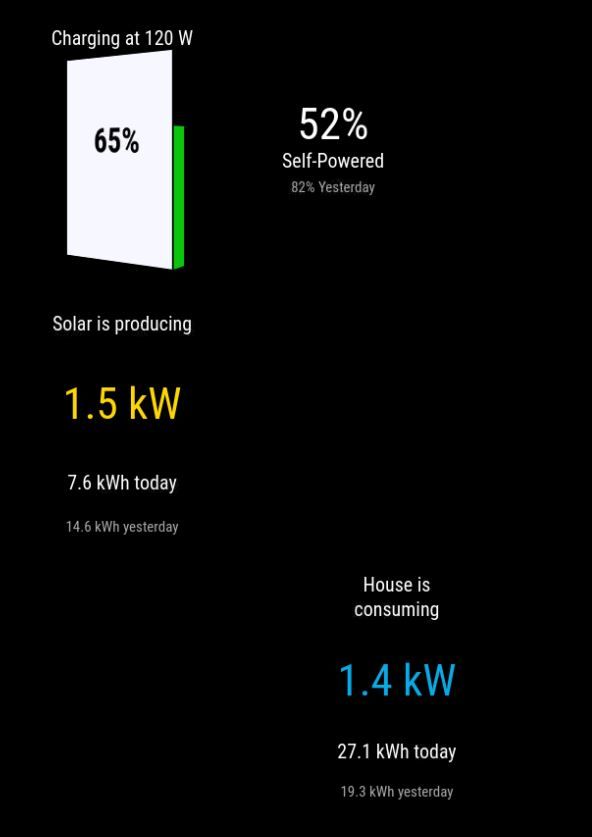
Installed Module - Powerwall - But the graphs don't display correctly
-
So the data does populate - I can see numeric values and they are correct. But the visuals as shown here - https://github.com/MikeBishop/mmm-powerwall - Don’t display like this. Just text/numeric values.
What am I missing?!
Hello! It looks like you're interested in this conversation, but you don't have an account yet.
Getting fed up of having to scroll through the same posts each visit? When you register for an account, you'll always come back to exactly where you were before, and choose to be notified of new replies (either via email, or push notification). You'll also be able to save bookmarks and upvote posts to show your appreciation to other community members.
With your input, this post could be even better 💗
Register Login