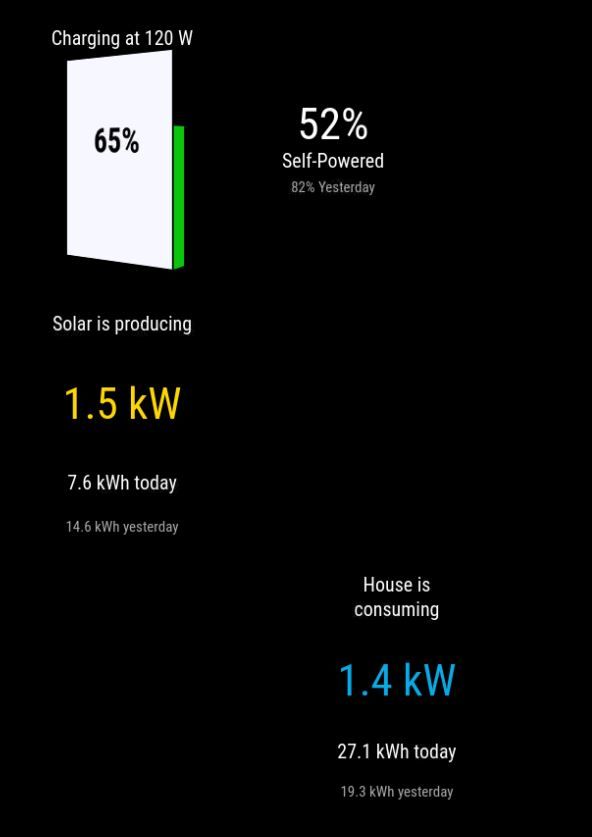
So the data does populate - I can see numeric values and they are correct. But the visuals as shown here - https://github.com/MikeBishop/mmm-powerwall - Don’t display like this. Just text/numeric values.
What am I missing?!
So the data does populate - I can see numeric values and they are correct. But the visuals as shown here - https://github.com/MikeBishop/mmm-powerwall - Don’t display like this. Just text/numeric values.
What am I missing?!
Re: MMM-Powerwall
I can’t seem to get the graphs to display - it’s pulling the correct numerical values but no pretty graphs like yours. What am I missing? - TIA