Read the statement by Michael Teeuw here.
MMM-HASS-Chart: Charts with sensor data from Home Assistant
-
Hey,
I want to present to you my first little module: MMM-HASS-Chart
It displays historical sensor data from Home Assistant as a ChartJS graph on your mirror.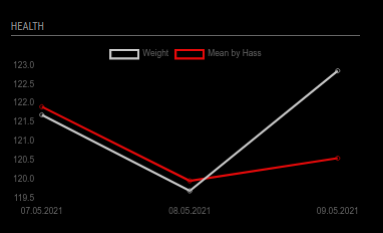
It is highly modular and dynamic. Please check Github to find a detailed description: MMM-HASS-Chart
I am happy to receive any feedback on implementation, issues, or functionality.
-
New feature:
Automatically generate min/mean/max graphs for each sensor.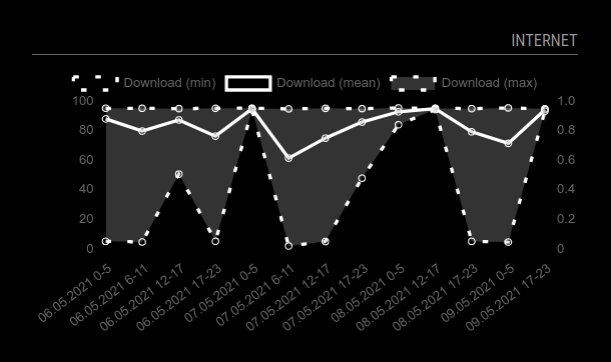
Hello! It looks like you're interested in this conversation, but you don't have an account yet.
Getting fed up of having to scroll through the same posts each visit? When you register for an account, you'll always come back to exactly where you were before, and choose to be notified of new replies (either via email, or push notification). You'll also be able to save bookmarks and upvote posts to show your appreciation to other community members.
With your input, this post could be even better 💗
Register Login