MagicMirror Forum
    • Recent
    • Tags
    • Unsolved
    • Solved
    • MagicMirror² Repository
    • Documentation
    • 3rd-Party-Modules
    • Donate
    • Discord
    • Register
    • Login
    A New Chapter for MagicMirror: The Community Takes the Lead
    Read the statement by Michael Teeuw here.

    Graph module

    Scheduled Pinned Locked Moved Requests
    26 Posts 9 Posters 19.7k Views 9 Watching
    Loading More Posts
    • Oldest to Newest
    • Newest to Oldest
    • Most Votes
    Reply
    • Reply as topic
    Log in to reply
    This topic has been deleted. Only users with topic management privileges can see it.
    • Q Offline
      qistoph
      last edited by

      Hi @feedparakeet,

      The MMM-dynchart was a sample used to show some ideas.

      A better example for you would be my Vitadock module:
      https://github.com/qistoph/MMM-vitadock

      Maybe you can use it to base your module on.

      If you could give a more detailed description of what you what to graph, I might be able to help you.

      F 1 Reply Last reply Reply Quote 0
      • D Offline
        d3r
        last edited by

        I’m logging room temperature and humidity to a csv file. How would I go about using the data to graph it to my mirror?

        F 1 Reply Last reply Reply Quote 0
        • PointPubMediaP Offline
          PointPubMedia
          last edited by

          I’m using a bunch of graph already… why not using Grafana to record the data and the iFrame module to display them in your MM ?

          D F 2 Replies Last reply Reply Quote 0
          • D Offline
            d3r @PointPubMedia
            last edited by

            @PointPubMedia said in Graph module:

            I’m using a bunch of graph already… why not using Grafana to record the data and the iFrame module to display them in your MM ?

            That’s a good idea actually. I don’t know what grafana is, will look into it. I might just use the temperature logging python code I have and add a graphing portion to it as well and then use the iframe module to display the graph. Sounds feasible on paper.

            1 Reply Last reply Reply Quote 0
            • F Offline
              feedparakeet @PointPubMedia
              last edited by

              @PointPubMedia, thanks, Grafana looks good. I have it installed now to graph server’s cpu, network, e.t.c… Could you tell me please what do you use as a data source for Grafana to create custom graphs? I want to create bitcoin-usd graph, but I don’t know how can I put a data into Grafana.
              And how do use put Grafana’s graph into iFrame module? Are there any tricks you can share?

              PointPubMediaP 1 Reply Last reply Reply Quote 0
              • PointPubMediaP Offline
                PointPubMedia @feedparakeet
                last edited by

                @feedparakeet I disable the authentication in Grafana so I can use direct link to a graph without a username/password!

                In grafana, you can “export” a graph and it will give you a direct URL that you can use directly in an iFrame!

                For datasource, currently I’m using a module in my home automation that already send data to grafana!

                I need to work later on some unix script to send data directly in grafana!

                F 1 Reply Last reply Reply Quote 1
                • F Offline
                  feedparakeet @PointPubMedia
                  last edited by

                  @PointPubMedia Thanks! It worked!
                  Final setup is: php scripts which grab info from fixer.io (eur + usd) and btc-e.com (bitcoin), put them to InfluxDB and display with Grafana. Works like a charm!
                  Here is a screenshot from my MM. Looks beautiful in general. But still, few minor things to work on.

                  0_1488327795941_MM.png

                  J 1 Reply Last reply Reply Quote 0
                  • F Offline
                    feedparakeet @qistoph
                    last edited by

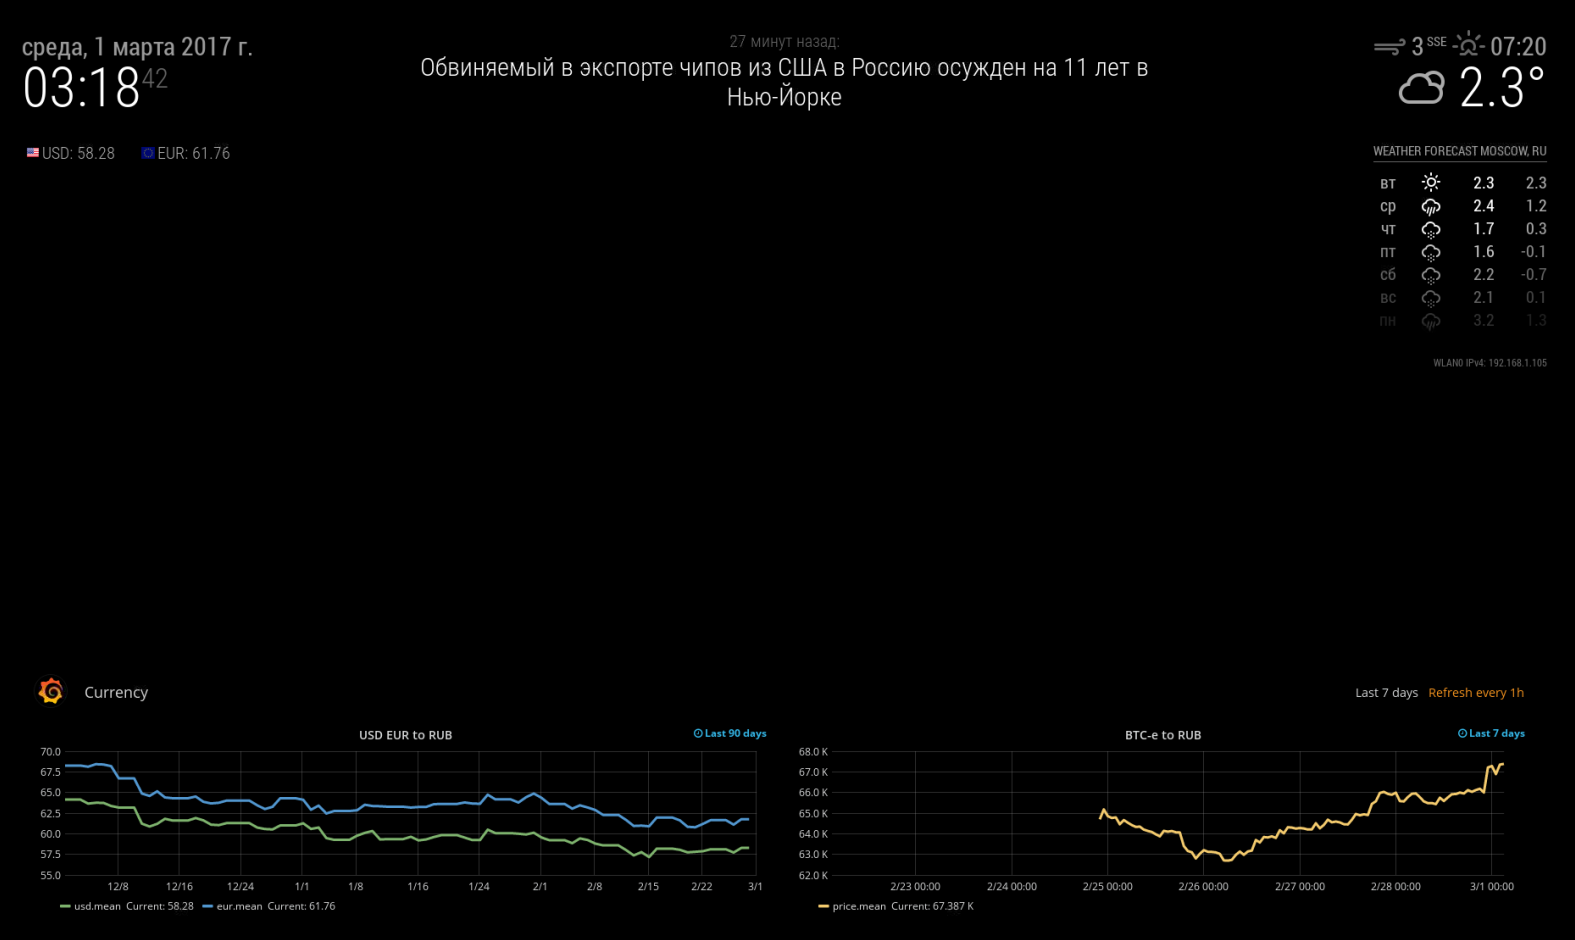
                    @qistoph, thank you, I really appreciate your response. It took me few weeks to understand how do graphs work and get what I need. Finally I did it with Grafana + InfluxDB + PHP scripts. Now I understand that each graph is very special and you need quite a few options to get it work like you want. So, Grafana is the solution for what I was looking for. Don’t think it will be easy to create a universal graph module to satisfy all my needs, like I thought it before. Thanks anyway!

                    1 Reply Last reply Reply Quote 0
                    • F Offline
                      feedparakeet @d3r
                      last edited by

                      @d3r It is absolutely possible with Grafana + iFrame module and a bit of magic lol

                      1 Reply Last reply Reply Quote 0
                      • J Offline
                        jalmaas @feedparakeet
                        last edited by

                        @feedparakeet How did you get grafana to use all black background?

                        F 1 Reply Last reply Reply Quote 0
                        • 1
                        • 2
                        • 3
                        • 3 / 3
                        • First post
                          Last post
                        Enjoying MagicMirror? Please consider a donation!
                        MagicMirror created by Michael Teeuw.
                        Forum managed by Sam, technical setup by Karsten.
                        This forum is using NodeBB as its core | Contributors
                        Contact | Privacy Policy