I repost my message since it appears it never been posted…
@sdetweil thank you for your help! Unfortunately, no issue are produced, so I don’t know how to progress on that.
I repost my message since it appears it never been posted…
@sdetweil thank you for your help! Unfortunately, no issue are produced, so I don’t know how to progress on that.
Dear all,
I’d like to use two different modules, namely MMM-WeatherChart and the no more maintained MMM-Chart.
If my config defines these two modules such like:
                  {
			"module": "MMM-WeatherChart",
			"position": "top_center",
			"config": {
                               ...
			}
		},
		 {
		 	module: 'MMM-Chart',
		 	position: 'bottom_center',
		 	header: 'Production Solaire',
		 	config: {
                                 ...
                      },
                  },
then only the second one (MMM-Chart) is visible (at the bottom):
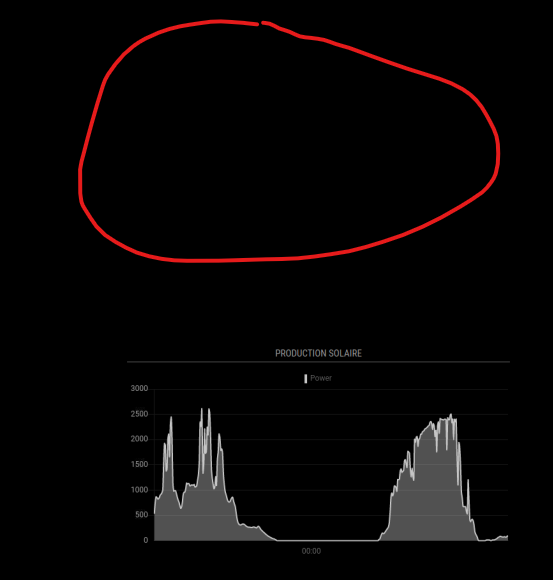
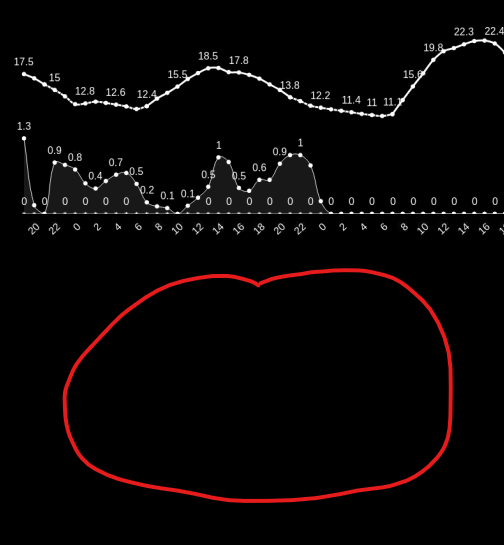
So it seems only the last module defined in the config file is visible.
Is there a known incompatibility issue for 2 modules that are using chart.js (as both are)? If not, what could be the reason for this behaviour?
Any help would be appreciated,
Best regards,
Thank you. However, most (all?) appear not being developed any more (or only support bar graph), unless I’m missing something?.
Dear all,
I’m storing locally on my raspberry some data fetched from other sources every minutes, and I would like to plot them dynamically on a magic mirror module. These data are like:
date1 time1 values1
date2 time2 values2
date3 time3 values3
While I’m OK in Python, I know nothing to Javascript. So I can format the .csv file to something else if needed, but I don’t know what module I can use to do the job.
Is anyone could indicate me how I could do that ? Many thanks in advance
Best regards,
Dear all,
I would like to develop a module which would display graphs created from webpage scraping. I’m totally able to code such a thing in Python, but I have no clue with Javascript (yet, but I’m willing to learn). So I wonder which solution would be the best to your opinion :
i) a all javascript module
ii) some javascript which would launch a Python script behind the hood (possible?)
or something else?
Please let me know any advise or comment which could help me on how and where to begin.
Thanks in advance,