Read the statement by Michael Teeuw here.
Dutch Rainforecast graph (Buienradar)
-
Based on a Dutch public api for rain forecast (BuienRadar).

More info on Github
Config options
The following properties can be configured:
First Header Second Header lat the latitude of your location lon the longitude of your location width controls the size of the module height controls the size of the module lineWidth the thicknes of the line lineColor the color of the line fillColor the color of the area under the line maxPower the maximum number on the y axis rainText The text you want to display in front of the last time received in the last call noRainText the text you want to display if no rain is expected untill the last time in the last call. nrOfTimeLabels optional value, adds a number of time labels under the graph, advised values: 2-5. If non existant or 0 reverts to default behaviour. -
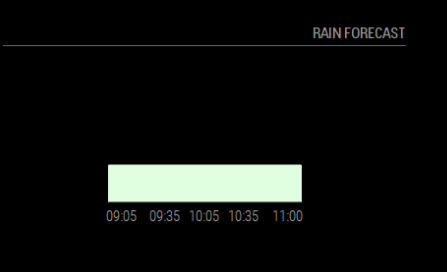
Hi, All I’m getting is this graph. Using the default module settings.
-
Looks smaller than expected, are width and height set correctly in the config?
Hello! It looks like you're interested in this conversation, but you don't have an account yet.
Getting fed up of having to scroll through the same posts each visit? When you register for an account, you'll always come back to exactly where you were before, and choose to be notified of new replies (either via email, or push notification). You'll also be able to save bookmarks and upvote posts to show your appreciation to other community members.
With your input, this post could be even better 💗
Register Login