Read the statement by Michael Teeuw here.
covid bell curve line graph tracker
-
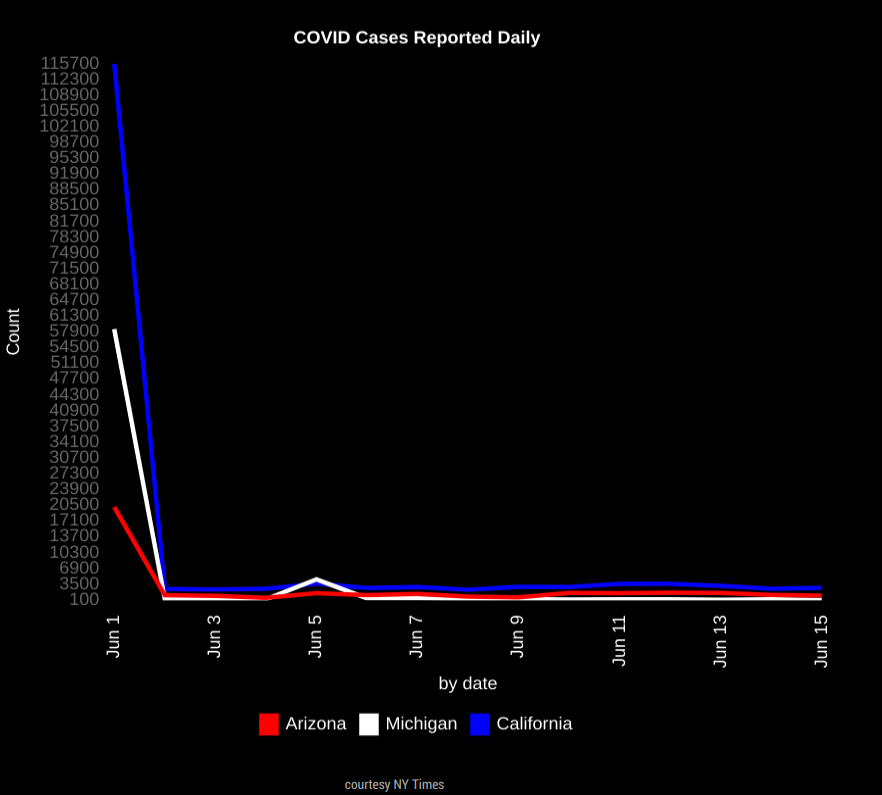
This is the big initial spike i dont know how to get rid of. Sorry last attachment wouldnt work.
-
@darbos I would start with a step of 50 and a max of 50. if the numbers are higher the chart engine will auto adjust.
if U have too many ticks on the left axis, then make the step higher (100) and raise the max to 100
-
@darbos for the spike, move the start day to the 2nd or 3rd
-
@sdetweil here is my cases by day by state
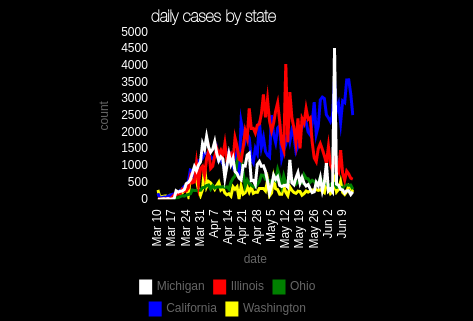
min 0, max 500, step 500
(chart 300x300)one cool thing, when u make the step low, u can turn off individual sources to see the remaining adjust
just click on the legend entry to turn it offlooks like Michigan had a reporting spike
-
Looks like the EU site used for the data is currently down
-
@sdetweil Sorry for just getting back. Thanks for taking the time to explain and help.
I follow what your saying and made the changes. Looks like the reporting site is down so I will have to wait to make sure mine looks as good as yours:)
Thanks again.
-
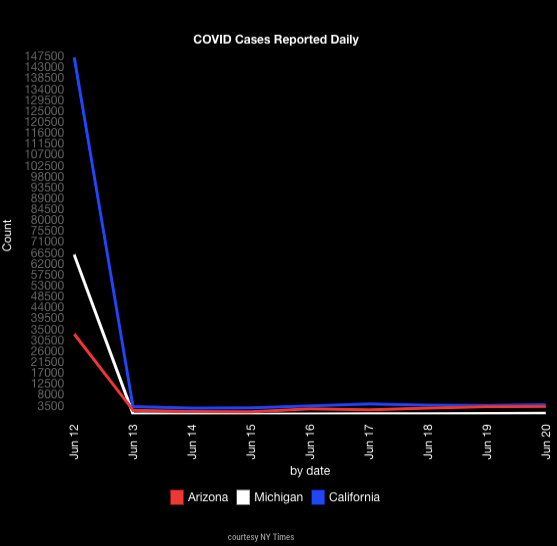
@sdetweil Would you mind double checking my config, Im still seeing a large spike at the begining…
Ive tried changing the start date to the 3rd, 10th, and 12th with the same result. Ive also tried both 0,100,100 and 0,500,500.
Thank you much!
	{
		module:"MyCovid19",
		position:"bottom_center",
		config:{
			states:['Arizona','Michigan','California'],
			line_colors:['red','white','blue'],
			chart_type:"cases",
			chart_title:"COVID Cases Reported Daily",
			ranges:{min:0,max:500,stepSize:500},
                            backgroundColor: "transparent",
		      width: 600,
		      height: 500,
		      debug: false,
		      startDate: '06/12/2020'
		}
    },
***EDIT: The copy/paste spacing is off, but I double checked and spacing is correct in my file…with no trailing white space.
-
@sdetweil Its like its pulling the total first and then displaying dailys no matter what date I start at…I think anyway.
-
@darbos I see the same will debug later tonight. family dinner first
-
@sdetweil ok thank you much!!!
