Read the statement by Michael Teeuw here.
Column graph to replace StatusBoard by Panic. (JSON data into graphs)
-
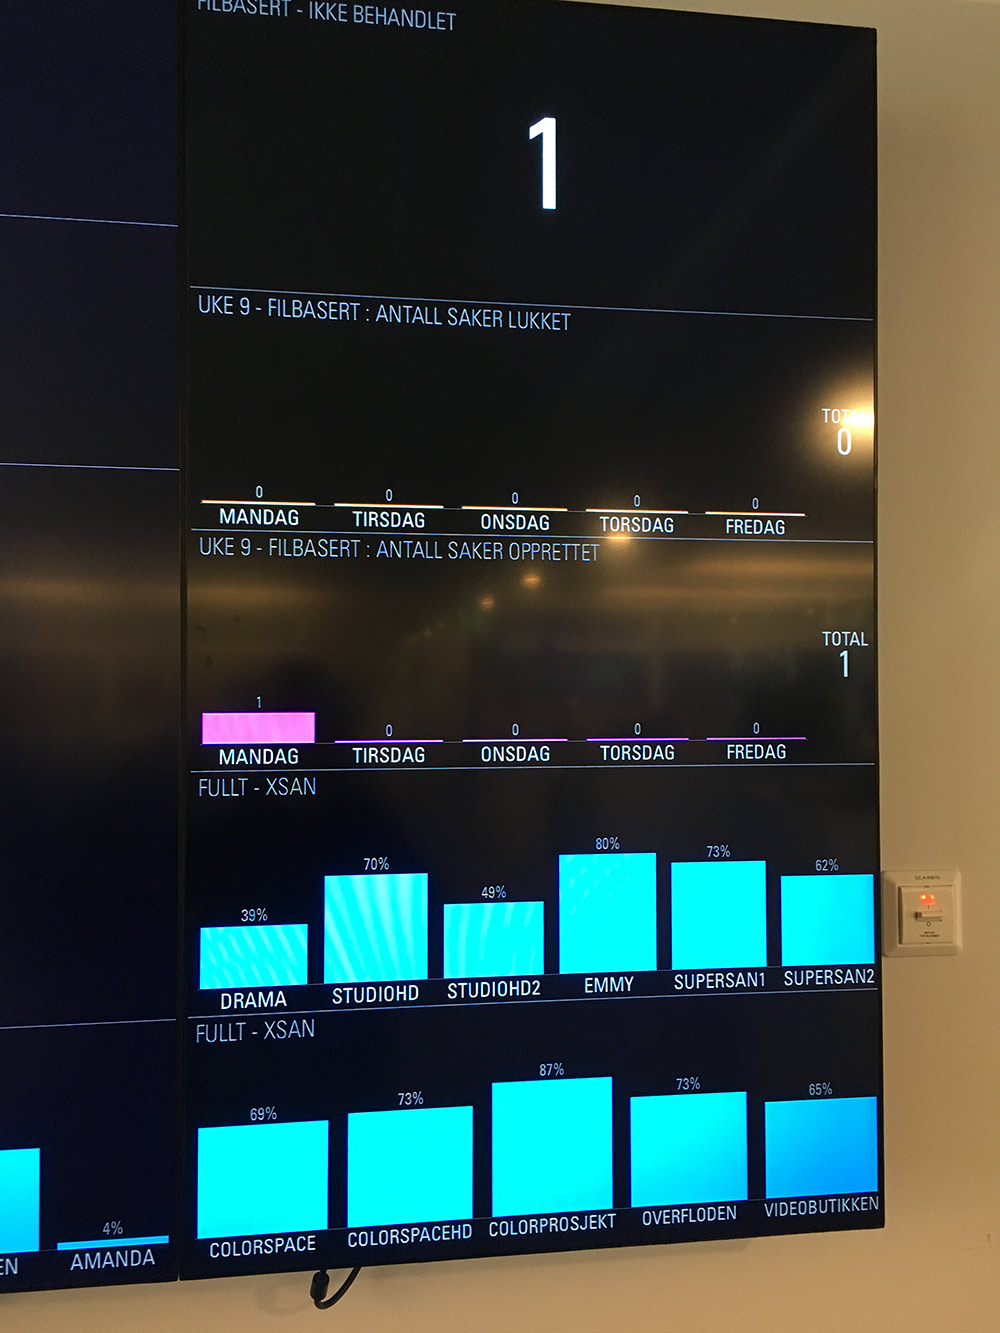
We’ve been using Panics Statusboard for years. And love it. Panic decided last year to discontinue the product. So we’re switching to MM now. What StatusBoard did really nicely was having a “module” that you configure to a JSON file path. And it will render the graph data into nice column graphs, like this:
If there’s only one value/digit, it displays it as a number. But if there is multiple datapoints, it will display that as a graph. And a simple flag setting lets you configure between columns graphs or regular graphs.
The data input format looks like this:
{
  "graph" : {
    "title" : "Soft Drink Sales",
    "datasequences" : [
      {
        "title" : "X-Cola",
        "datapoints" : [
          { "title" : "2008", "value" : 22 },
          { "title" : "2009", "value" : 24 },
          { "title" : "2010", "value" : 25.5 },
          { "title" : "2011", "value" : 27.9 },
          { "title" : "2012", "value" : 31 },
        ]
      },
      {
        "title" : "Y-Cola",
        "datapoints" : [
          { "title" : "2008", "value" : 18.4 },
          { "title" : "2009", "value" : 20.1 },
          { "title" : "2010", "value" : 24.8 },
          { "title" : "2011", "value" : 26.1 },
          { "title" : "2012", "value" : 29 },
        ]
      }
    ]
  }
}
Tonnes of more info here:
https://library.panic.com/statusboard/graph_tutorial/
Hello! It looks like you're interested in this conversation, but you don't have an account yet.
Getting fed up of having to scroll through the same posts each visit? When you register for an account, you'll always come back to exactly where you were before, and choose to be notified of new replies (either via email, or push notification). You'll also be able to save bookmarks and upvote posts to show your appreciation to other community members.
With your input, this post could be even better 💗
Register Login