@BKeyport Why? I needed to display data from my own datasets and API not supported in existing modules, kinda had to make them myself then? I do it to learn more coding.
A New Chapter for MagicMirror: The Community Takes the Lead
Read the statement by Michael Teeuw here.
Read the statement by Michael Teeuw here.
A
Best posts made by Ashaman
-
RE: My Magic "Mirror" Desk Displayposted in Show your Mirror
-
RE: My Magic "Mirror" Desk Displayposted in Show your Mirror
@BerkSmash1984 Really good setup! Thank you for inspiration on how to organize a bunch of modules in a good way!
Latest posts made by Ashaman
-
RE: My Magic "Mirror" Desk Displayposted in Show your Mirror
@BKeyport Why? I needed to display data from my own datasets and API not supported in existing modules, kinda had to make them myself then? I do it to learn more coding.
-
RE: My Magic "Mirror" Desk Displayposted in Show your Mirror
@BerkSmash1984 I’m in the process of setting up mine, and seeing how you organized yours gave me lots of ideas! 👍
Mine takes time though, because so far I’ve only added custom modules I make myself. 😅
Need to start implementing more premade modules. 😂Is MMM-Pages working for you?
I tried to use it the first week I was new to MM and had problems, so I’m currently using MMM-Carousel. -
RE: My Magic "Mirror" Desk Displayposted in Show your Mirror
@BerkSmash1984 Really good setup! Thank you for inspiration on how to organize a bunch of modules in a good way!
-
RE: Encapsule chart.js plugins?posted in Development
@sdetweil Yes, I see that now. I also think I have a strategy if I ever need more modules using chart.js. Make sure they run the same version, and initialize in the “first” module only.
Thank you so much for your help!
-
RE: Encapsule chart.js plugins?posted in Development
@sdetweil
Some further testing:
If i define the chart.umd.js in the price module, and comment out the line for chart.umd.js in the consumption-module, the modules work in the order I want!getScripts: function() {
return [
this.file(‘vendor/chart.umd.js’),If the module that is listed “on top” in the config gets the chart.umd.js script, it will fix both modules.
(The lables is placed wrong in the consumption-module if it is above the price-module, but I guess that can be fixed somehow.)
Problem is solved, but I don’t know why! :grinning_face_with_sweat:
-
RE: Encapsule chart.js plugins?posted in Development
I tried to swap the order of the modules and have the consumption-module first, then the price-module, and they suddenly work as intended!!
I havw tried that before, but it’s been a while since I tested that, so I have probably changed something.
Not optimal, but a workaround I can live with.
Still apprechiate any feedback if someone have a suggestion! -
RE: Encapsule chart.js plugins?posted in Development
@sdetweil Can chart.js run on two different modules with different plugins without interfering with one another?
Both modules have chart.js 4.4.1 installed.
Both use chartjs.umd.js (min was not installed with npm, as I understand, this was changed last year?).I might try to just combine the two modules into one module, if you think it is worth a try?
-
Encapsule chart.js plugins?posted in Development
Hi everyone, this is my first post here.
I started to set up my MM one month ago.
Initialy I set up some basic modules, but I had trouble finding modules that could handle what I wanted to display on my MM.
I have very little experience with coding, but it’s 2024 and I use AI a lot at work. I have mostly used AI to guide me in making my custom modules, and AI can help with a lot (but not everything).I have made 4-5 custom modules now, three of them focus on electricity info, the rest is updated weather-modules that uses the new Yr.no API.
The problem I have now is with chart.js plugins.
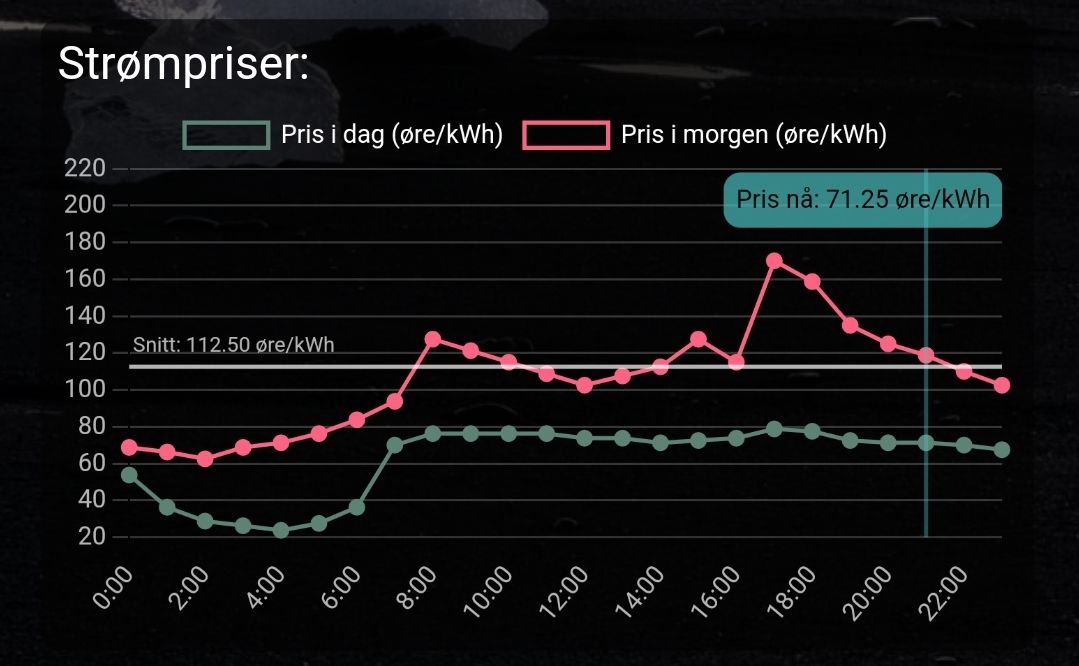
I have one module to display prices the next few days. It uses chart.js annotations.
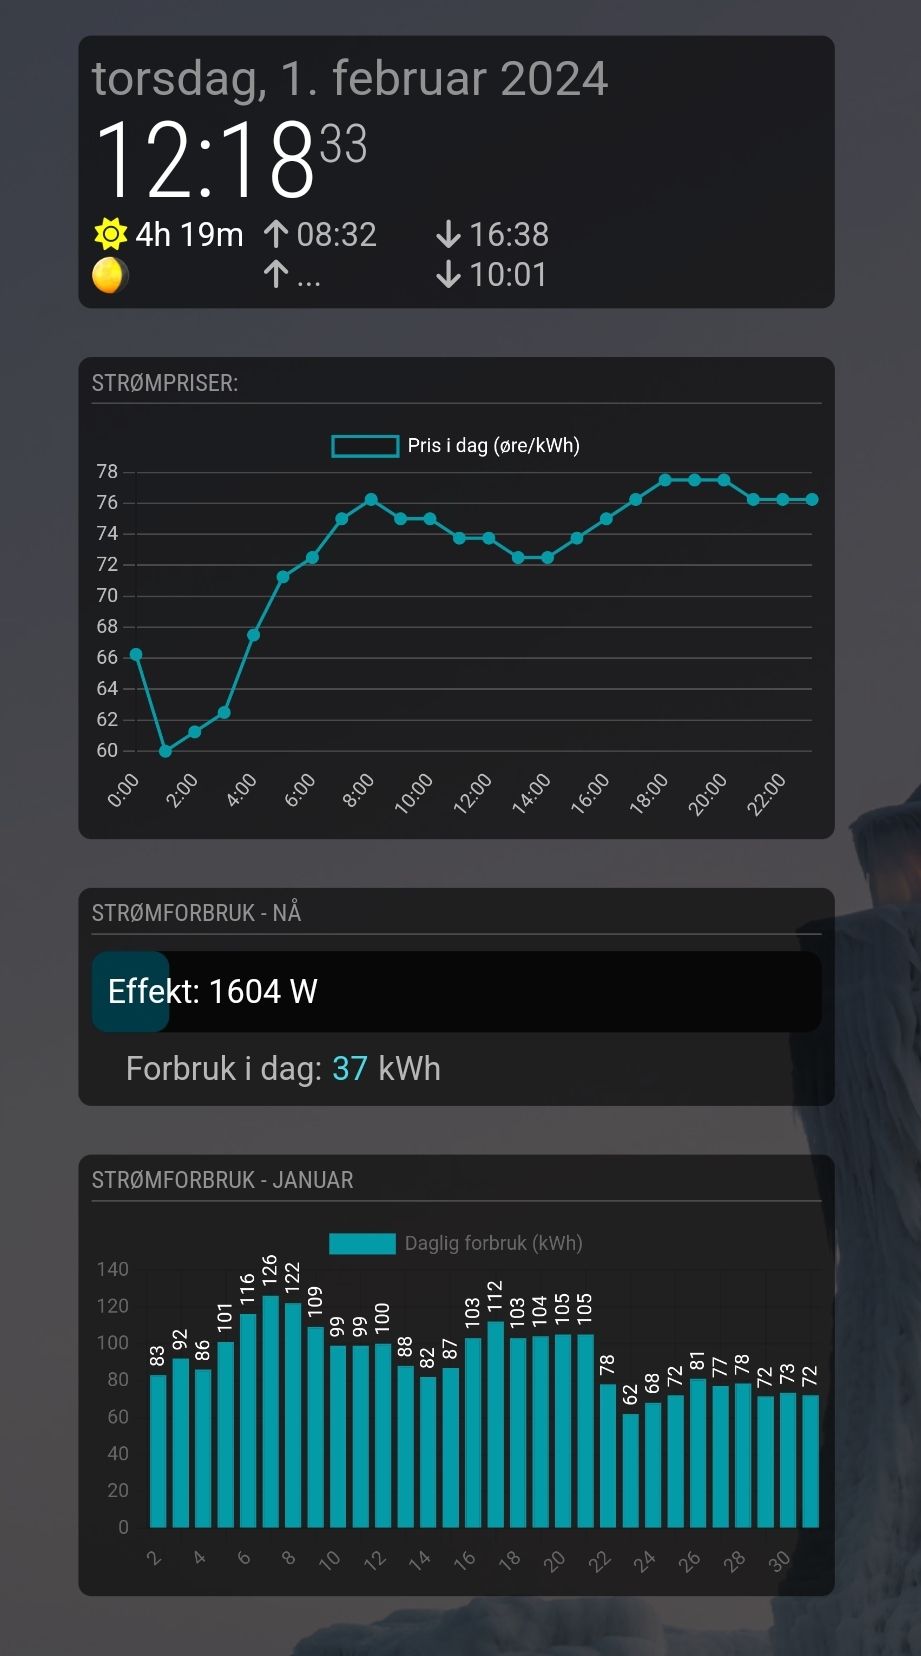
The other module display my daily consumption for the month, and it uses chart.js datalabels.
My problem is that if both modules are active, the module drawn “last” removes the plugin on the other. So the price-module loose the annotations.
Is there a way to “encapsule” chart.js inside each module? Or any other way to make sure they don’t interfer with eachother?
I don’t have much experience with the “depths” on how MM works, so any enlightenment is highly apprechiated!Both modules have different canvas-id, both have chart.umd.js installed and start them from the node_modules (I have tried a vendors folder too, but no luck).
I can paste/attach the code if needed.