Read the statement by Michael Teeuw here.
MMM-COVID19 not updating
-
Screen says: statistic taken October 9, 3:04am. I tried a git pull to update the module, but no change.
-
Yes, the same here
-
Seems like the service on Rapid API has changed to a paid one.
-
mine only draws charts
-
@sdetweil I built one on Amazon Alexa but Amazon wouldn’t publish it. I’ll look at building one for here.
-
@sdetweil You have some Screens?
-
@sdetweil Thanks for your module, it is working very good to show me only the new cases in Germany
-
@sdetweil Could you display for cases at the graph the last count for today as option?
-
@mumblebaj yes, so this module is now death.
-
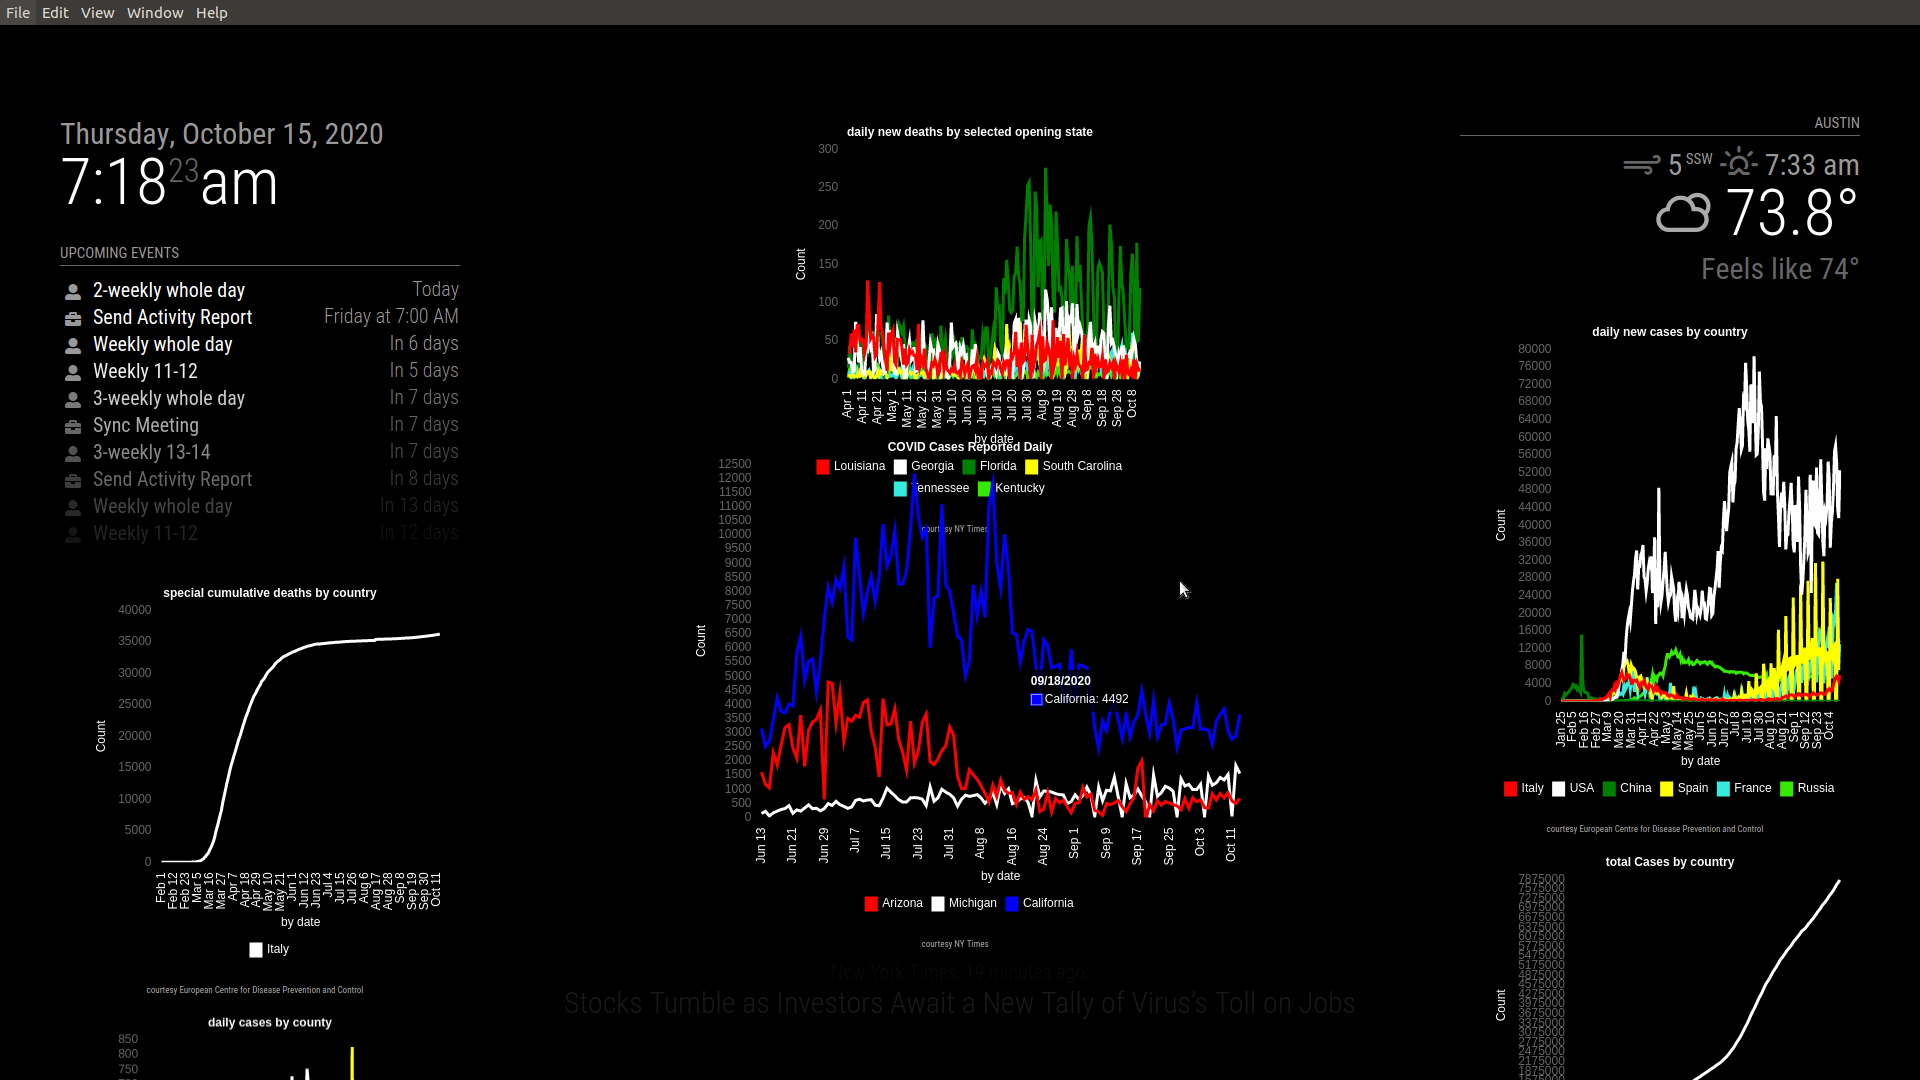
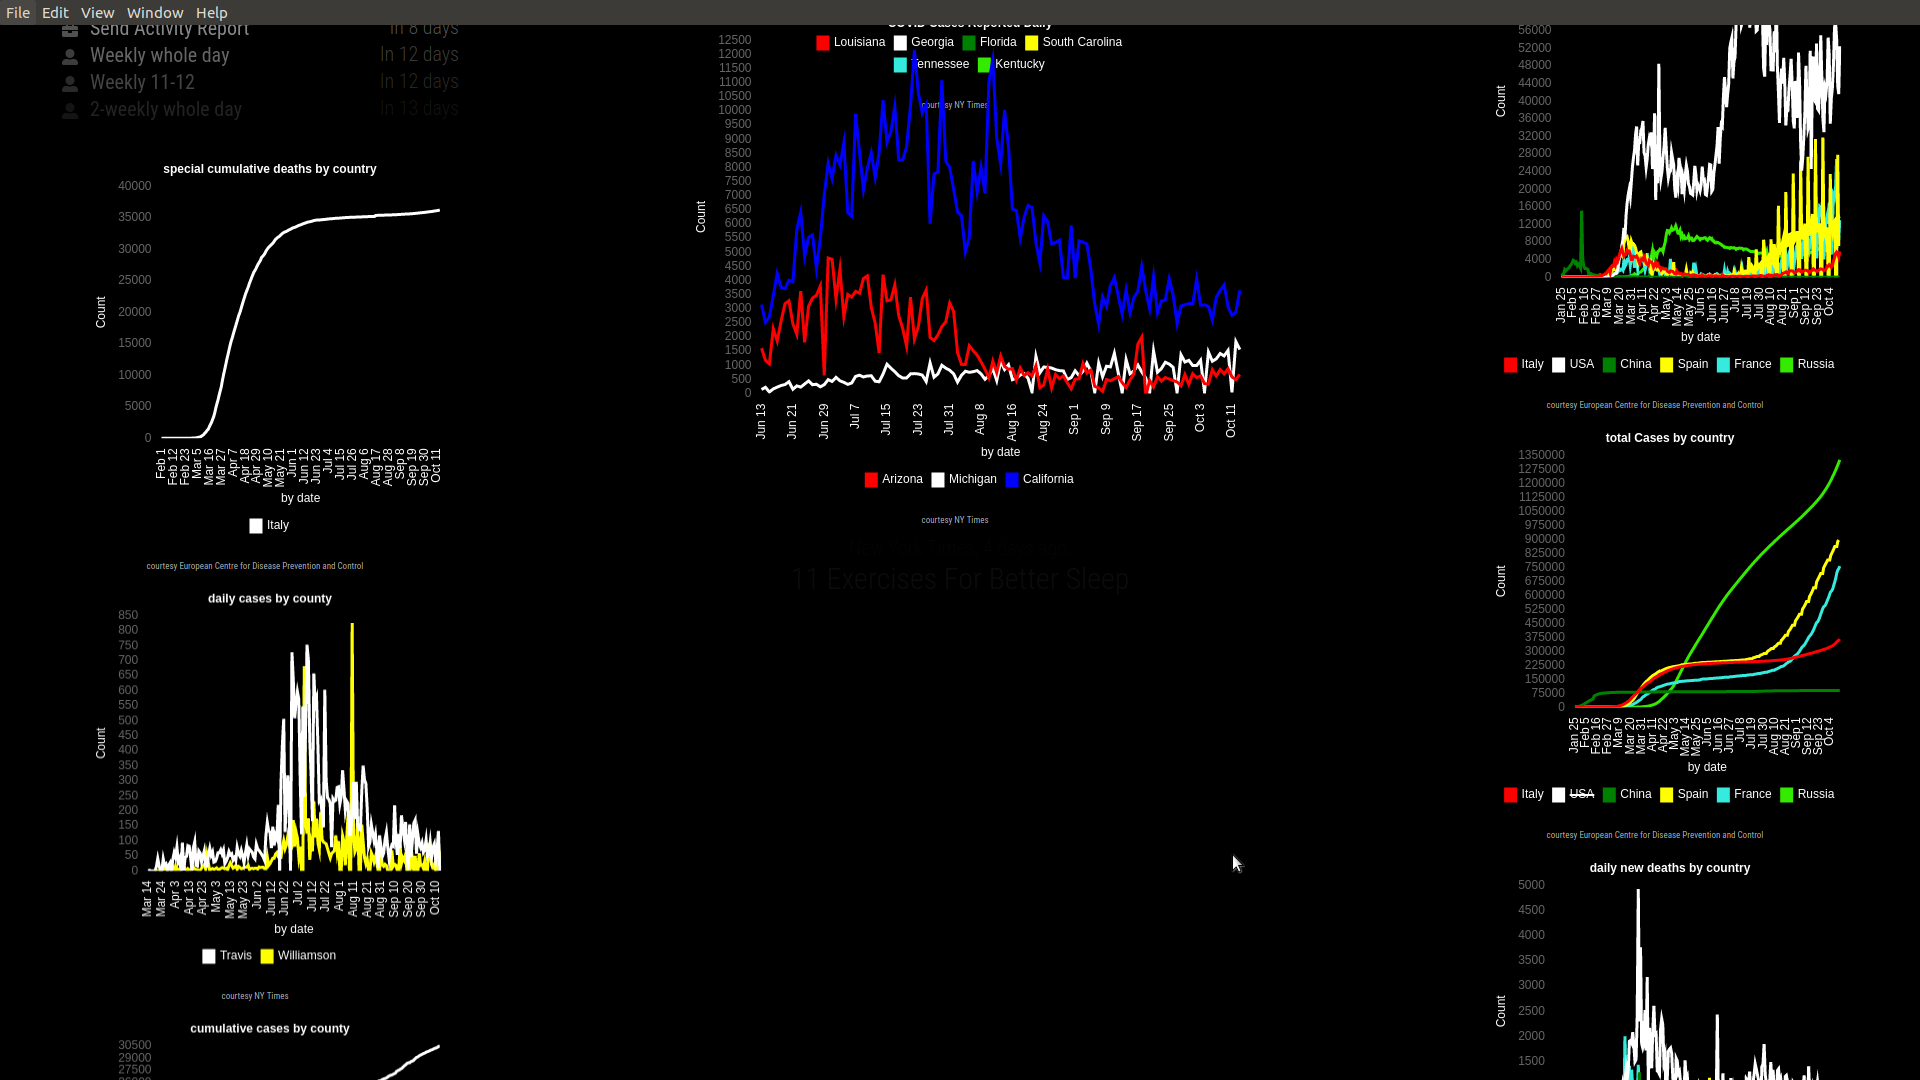
@bjoern see this page, I have lots of charts shown
-
@Baraka no, I don’t think that is useful. my charts are intended to allow one to see the shape of the curve.
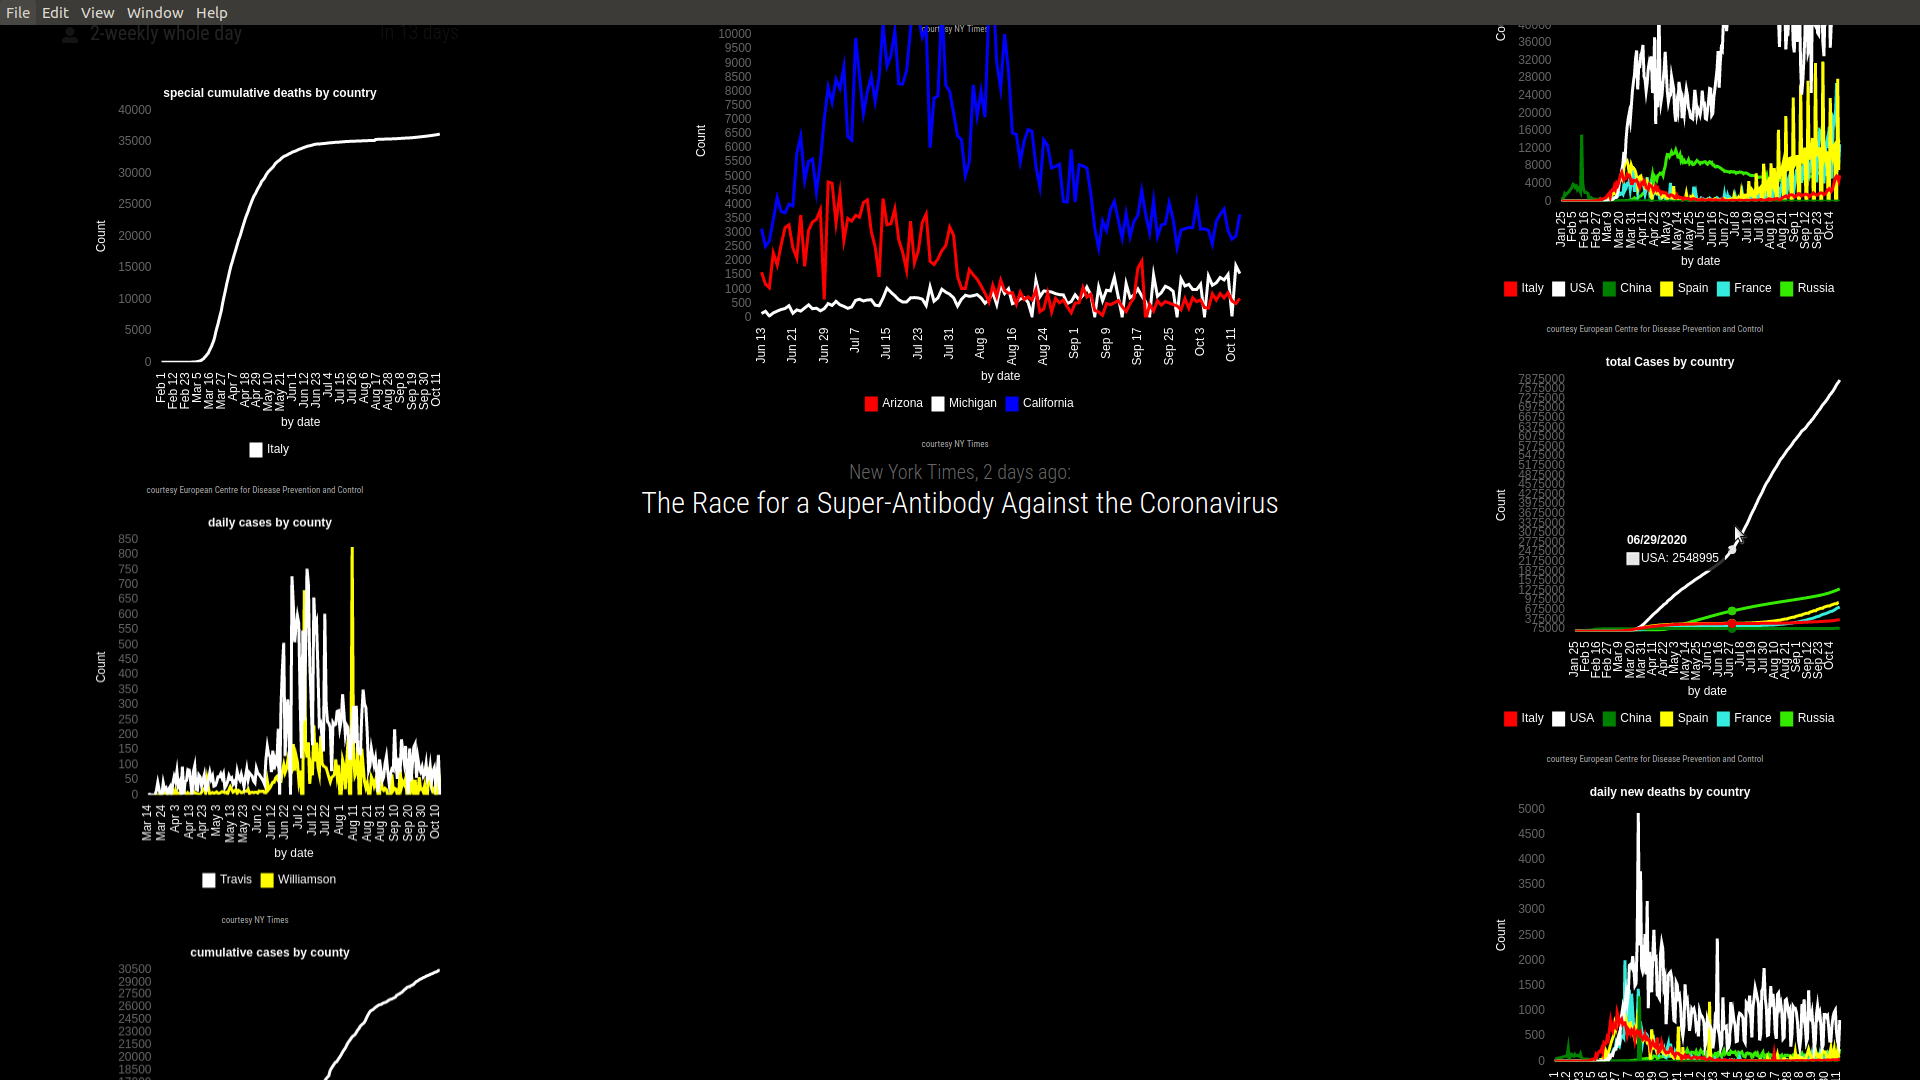
here the middle chart on the right side shows Cumulative cases by country, you can see the good flat line til Aug 10th, while Italy is holding on (but starting to turn)
and the volume of new cases is significantly more that each countries prior reported amount…
I don’t need to know if its 875432 or 875555the actual number is pretty useless.
IF you use the chart, and have access to a mouse, you can hover over the chart line to see the number used
( you can see the hover info in the same middle chart on the right side here)u can also turn off individual inputs to the chart. (by clicking on the box in the legend)
here I turned off USA on the same chart , now u get a better view of the other countries
-
@sdetweil Nice one Sam. The RapidAPI seems to be working again for some reason. Not sure why but it is working.
-
@sdetweil today morning no data or no chart for cases
-
@mumblebaj yes , you are right , we get data. time stamp at this morning looks good
-
@Baraka looks good right now… sometimes they take awhile to release the data… I’ve seen til almost 2pm us eastern time (gmt+5)
-
@sdetweil i have always this error message: [MyCovid19 Loading data for Chart “Cases”] since this morning. :-(
-
@Baraka oh, sorry, was replying about my module… Not this one
-
@sdetweil it is your module , who is not working at the moment
-
@Baraka hm…
use a browser, go to this page
https://www.ecdc.europa.eu/en/publications-data/download-todays-data-geographic-distribution-covid-19-cases-worldwide
and click on download csv in the middle of the page
this is the data the module uses. I can access the file and it is current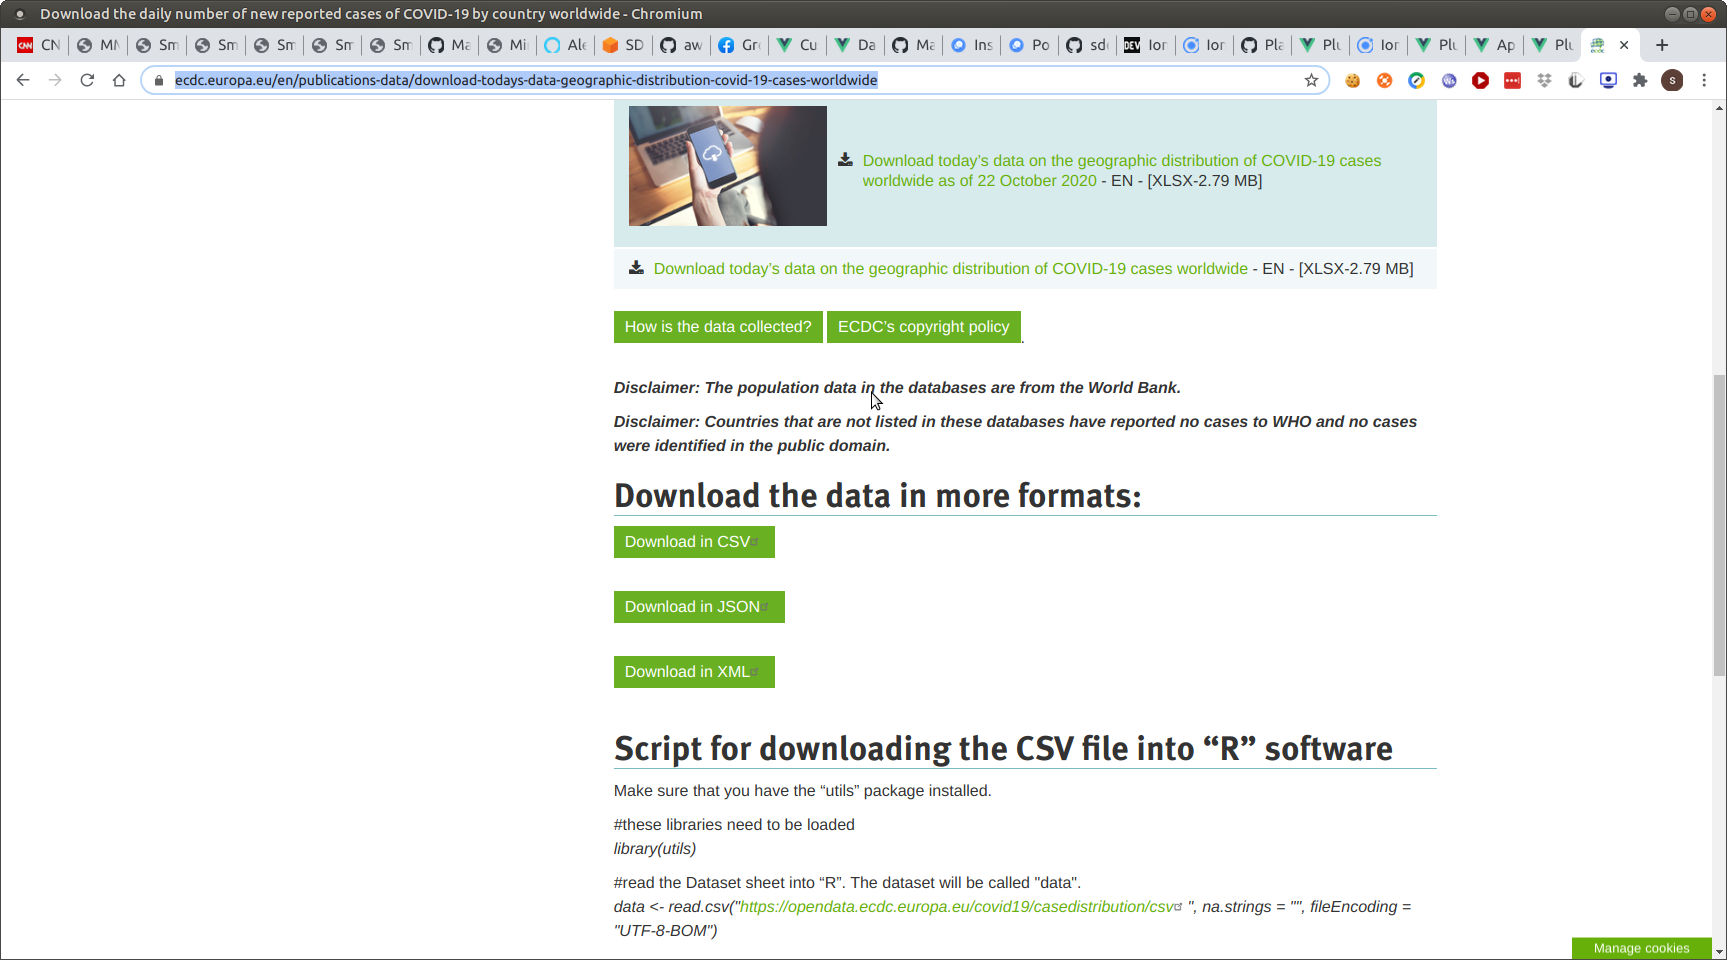
also, can u look in the log (either the window for npm start, or pm2 logs --lines=??? for pm2
??? is a number, default 15the module should retry every 15 minutes
-
i have this in the log:
requested file exists=modules/MyCovid19/countries-rawdata-10-22-2020.csv sending back to module_16_MyCovid19_4881
ready to get data id=module_16_MyCovid19_4881
check for file =modules/MyCovid19/countries-rawdata-10-22-2020.csv
processing id=module_16_MyCovid19_4881 file=modules/MyCovid19/countries-rawdata-10-22-2020.csv fields=[object Object]
done processing file id=module_16_MyCovid19_4881
have data, now filter id=module_16_MyCovid19_4881
processing for [“Germany”]
location=Germany
there are 0 entries to filter
send filtered data id=module_16_MyCovid19_4881
Hello! It looks like you're interested in this conversation, but you don't have an account yet.
Getting fed up of having to scroll through the same posts each visit? When you register for an account, you'll always come back to exactly where you were before, and choose to be notified of new replies (either via email, or push notification). You'll also be able to save bookmarks and upvote posts to show your appreciation to other community members.
With your input, this post could be even better 💗
Register Login