MagicMirror Forum
    • Recent
    • Tags
    • Unsolved
    • Solved
    • MagicMirror² Repository
    • Documentation
    • 3rd-Party-Modules
    • Donate
    • Discord
    • Register
    • Login
    A New Chapter for MagicMirror: The Community Takes the Lead
    Read the statement by Michael Teeuw here.

    covid bell curve line graph tracker

    Scheduled Pinned Locked Moved Solved Requests
    89 Posts 6 Posters 54.7k Views 8 Watching
    Loading More Posts
    • Oldest to Newest
    • Newest to Oldest
    • Most Votes
    Reply
    • Reply as topic
    Log in to reply
    This topic has been deleted. Only users with topic management privileges can see it.
    • S Do not disturb
      sdetweil @sdetweil
      last edited by sdetweil

      @sdetweil after sending email, they have updated the csv file now…

      also, uploaded new version with lots of text formatting control, see the now long readme
      also added ability to change the start date for the chart, see startDate in the readme

      Sam

      How to add modules

      learning how to use browser developers window for css changes

      1 Reply Last reply Reply Quote 1
      • S Do not disturb
        sdetweil
        last edited by sdetweil

        now supports states charts too

        git pull,

        in config states:[] vs countries:[]

        alt text

        Sam

        How to add modules

        learning how to use browser developers window for css changes

        1 Reply Last reply Reply Quote 1
        • rafaelcotaR Offline
          rafaelcota
          last edited by

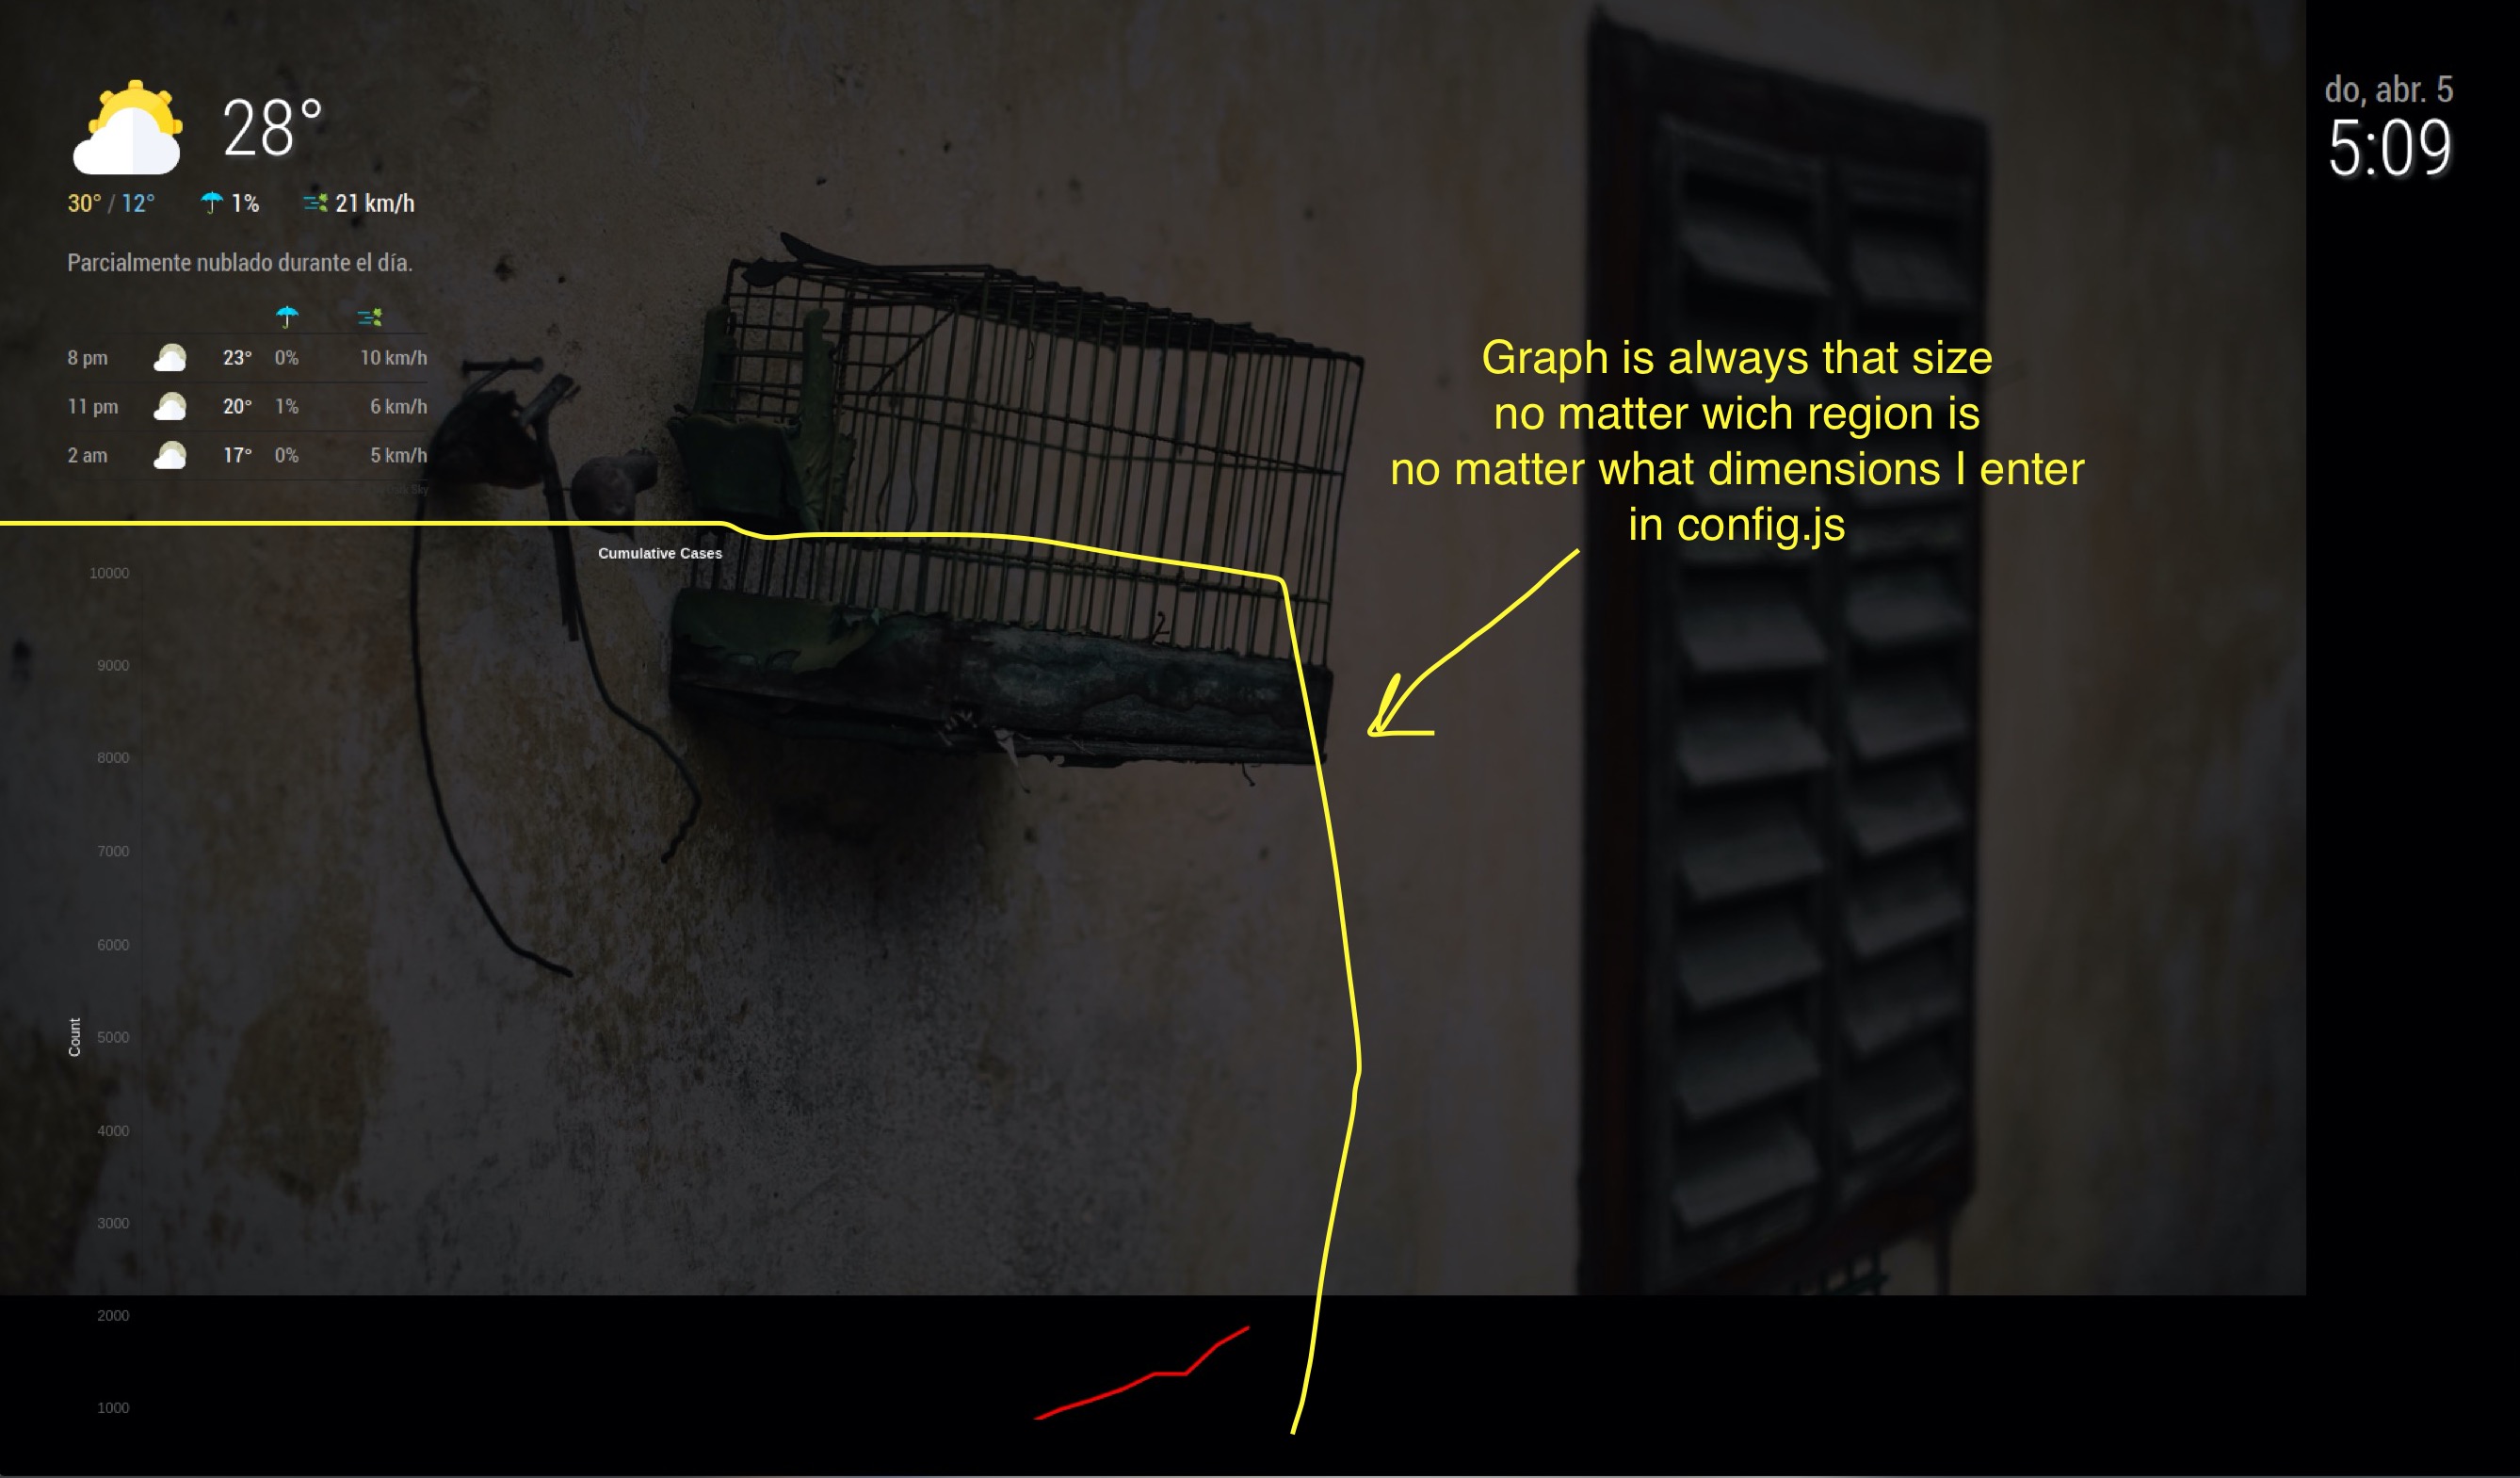
          Looks great! I’m looking forward in using this module, but I just don’t get the chart dimensions to work, the size is always the same, big, and it doesn’t matter which region I use.

          This is my config

                      {
                                      disabled: false,
                                      module:"MyCovid19",
                                      position:"top_left",
                                      config:{
                                              countries:["Mexico"],
                                              line_colors:['red','white','green','yellow','blue'],
                                              chart_type:"cumulative_cases",
                                              chart_title:"Cumulative Cases",
                                              ranges:{min:0,max:10000,stepSize:1000},
                                              startDate: "03/01/2020",
                                              backgroundColor: "transparent",
                                              width: 300,
                                              height: 500,
                                              debug:false,
                                      },
                      },
          

          And this is the result, I’ll try to attach a screen capture, let’s see if I can!

          alt text

          1 Reply Last reply Reply Quote 0
          • S Do not disturb
            sdetweil
            last edited by

            @rafaelcota hm… I usually have this

            		{
            			module:"MyCovid19",
            			disabled:false,
            			position:"top_left",
            			config:{
            				states:["Michigan", 'Texas','Illinois', 'Florida','California','Louisiana','Washington','New York',],
            				// line colors can be any definition of color either a name ,or a hex string
            				// one per country above, used in order,
            				line_colors:['red','white','green','yellow','#34ebde','#34eb00','purple','orange'],
            				//				
            				chart_type:"deaths",  // or "cumulative deaths"
            				chart_title:"daily new deaths by state", // however u want to label
            				// the vertical steps on the chart.. how tall u want it to be and how mant increments 
            				ranges:{min:0,max:000,stepSize:10},
            				// size of the chart in pixels
            			    width: 400,
            			    height: 800,	
            			    // only used if we need to debug something
            			    //debug:true,
            			    startDate:'03/10/2020',
            			    debug:true,
            			//    startLabel:['2/1/2020','3/1/2020']
            			    //backgroundColor: 'white',
            			}
            		}
            

            400x 400 (w x h)
            alt text

            but changed to 400 x 800 (w x h)

            alt text

            Sam

            How to add modules

            learning how to use browser developers window for css changes

            rafaelcotaR 1 Reply Last reply Reply Quote 1
            • S Do not disturb
              sdetweil
              last edited by

              I added the calendar and changed to 300 x 800

              alt text

              Sam

              How to add modules

              learning how to use browser developers window for css changes

              1 Reply Last reply Reply Quote 1
              • rafaelcotaR Offline
                rafaelcota @sdetweil
                last edited by

                @sdetweil I know, that’s how it supposed to work, but not in my mirror… It’s driving me crazy… I’ve tried almost everything…

                S 2 Replies Last reply Reply Quote 0
                • S Do not disturb
                  sdetweil @rafaelcota
                  last edited by sdetweil

                  @rafaelcota when was the last time you did a git pull?

                  I just used your definition and changed height to 800 and it came out right… (wrong image before)
                  alt text

                  Sam

                  How to add modules

                  learning how to use browser developers window for css changes

                  rafaelcotaR 1 Reply Last reply Reply Quote 1
                  • rafaelcotaR Offline
                    rafaelcota @sdetweil
                    last edited by

                    @sdetweil I’ve just downloaded today, just a few minutes before I tried.

                    This is what I’m seeing right now with the following config (tried with states now):

                                {
                                                disabled: false,
                                                module:"MyCovid19",
                                                position:"top_center",
                                                config:{
                                                        states:['Kentucky','Colorado','Arizona'],
                                                        line_colors:['red','white','green','yellow','blue'],
                                                        chart_type:"cumulative_cases",  // or "cumulative deaths"
                                                        chart_title:"Cumulative Cases", // however u want to label
                                                        ranges:{min:0,max:8000,stepSize:10000},
                                                        width: 200,
                                                        height: 300,
                                                        debug: true,
                                                },
                                },
                    

                    alt text

                    S 1 Reply Last reply Reply Quote 0
                    • S Do not disturb
                      sdetweil
                      last edited by

                      I don’t use any special classes

                                var c = document.createElement("div");   // < container for chart
                                c.style.width = self.config.width + "px";
                                c.style.height = self.config.height + "px";
                                self.wrapper.appendChild(c);
                      
                                canvas = document.createElement("canvas");   // < --- chart itself
                                canvas.id = "myChart" +self.ourID ;
                                canvas.style.width = (self.config.width -10) + "px";
                                canvas.style.height = self.config.height + "px";    
                                canvas.style.backgroundColor=self.config.backgroundColor;
                                c.appendChild(canvas);
                      

                      Sam

                      How to add modules

                      learning how to use browser developers window for css changes

                      1 Reply Last reply Reply Quote 0
                      • S Do not disturb
                        sdetweil @rafaelcota
                        last edited by sdetweil

                        @rafaelcota i don’t see it, but maybe there is a weird character between width and 400

                        so, take the space out, for both height and width

                        width:400,
                        height:800,
                        

                        how big is your screen?

                        Sam

                        How to add modules

                        learning how to use browser developers window for css changes

                        1 Reply Last reply Reply Quote 0
                        • 1
                        • 2
                        • 3
                        • 4
                        • 5
                        • 6
                        • 7
                        • 8
                        • 9
                        • 6 / 9
                        • First post
                          Last post
                        Enjoying MagicMirror? Please consider a donation!
                        MagicMirror created by Michael Teeuw.
                        Forum managed by Sam, technical setup by Karsten.
                        This forum is using NodeBB as its core | Contributors
                        Contact | Privacy Policy