MagicMirror Forum
    • Recent
    • Tags
    • Unsolved
    • Solved
    • MagicMirror² Repository
    • Documentation
    • 3rd-Party-Modules
    • Donate
    • Discord
    • Register
    • Login
    A New Chapter for MagicMirror: The Community Takes the Lead
    Read the statement by Michael Teeuw here.

    covid bell curve line graph tracker

    Scheduled Pinned Locked Moved Solved Requests
    89 Posts 6 Posters 52.3k Views 8 Watching
    Loading More Posts
    • Oldest to Newest
    • Newest to Oldest
    • Most Votes
    Reply
    • Reply as topic
    Log in to reply
    This topic has been deleted. Only users with topic management privileges can see it.
    • A Offline
      almostgithub @sdetweil
      last edited by

      @sdetweil Those are both commented out. Is there anything else that may perhaps cause each date to be almost an inch apart? I may just do a fresh install to negate any other settings I may have tweaked with, but strange that @rafaelcota had a similar problem as well

      S 2 Replies Last reply Reply Quote 0
      • S Offline
        sdetweil @almostgithub
        last edited by

        @almostgithub could u confirm that the div still has display=inline-block, when u look thru the elements…

        Sam

        How to add modules

        learning how to use browser developers window for css changes

        1 Reply Last reply Reply Quote 0
        • S Offline
          sdetweil @almostgithub
          last edited by sdetweil

          @almostgithub lets try some new debugging

          git clone again, make sure debug:true, in each MyCovid19 module def in config.js
          the update now only downloads the data file ONCE across all the modules (1 for countries, 1 for states if both used)

          add this module

          git clone https://github.com/sdetweil/MMM-Logging
          

          add it to the TOP of the module list like this

          	modules: [    // < top of module list
          	{ 
                      module: 'MMM-Logging',
                      disabled: false,
                      config: {
                          // Module functions out of the box with nothing set here.
                          // See below for configurable options.
                          echoLocal: true, 
                          echoRemote: true,
                          format: "{{message}} ({{folder}}/{{file}}:{{line}} {{method}})",
                      }
                  },
          

          start MM like this from a terminal window (make sure to stop the pm2 one if u use pm2)

          cd ~/MagicMirror
          npm start >>somefile.txt 2>&1
          

          run your test with 0.0.0.0
          please test both on system and remote browser access
          ctrl-c to stop
          change to localhost
          restart same command

          ctrl-c when done

          send me somefile.txt at my email sdetweil at gmail

          Sam

          How to add modules

          learning how to use browser developers window for css changes

          rafaelcotaR 1 Reply Last reply Reply Quote 0
          • rafaelcotaR Offline
            rafaelcota @sdetweil
            last edited by

            @sdetweil You’re great, man. You’ve been working with MyCovid19 to fix the bug, a weird and difficult one to identify; you’ve done tests, modifications, sent me instructions how to debug, and more modifications, and tests, and debugging; and files and emails went between us and finally, I can say IT WORKS just fine!

            Address is 0.0.0.0, so I can access it from any device at port 8080 and graphs are just the size I put in config.

            Thank you again for all your time, effort and concern.

            Stay safe

            S 1 Reply Last reply Reply Quote 0
            • S Offline
              sdetweil @rafaelcota
              last edited by

              @rafaelcota glad we found it… now I gotta fix another toughie…

              Sam

              How to add modules

              learning how to use browser developers window for css changes

              1 Reply Last reply Reply Quote 0
              • H Offline
                humdinger44
                last edited by humdinger44

                I’ve been keeping an eye on the NY data so i can compare it to my home state. Any idea whats happened there? It might be nice to have a 7 day rolling average option to smooth the data out. If that’s within the realm of “Not very difficult.”

                S 1 Reply Last reply Reply Quote 0
                • S Offline
                  sdetweil @humdinger44
                  last edited by sdetweil

                  @humdinger44 i see it too… will mess up the charts for a while… boooo

                  from the data source

                  **NEW:** Starting with data for May 6th, this data reports the total combined number of confirmed and 
                  probable Covid-19 cases and deaths where available. Many states and localities have started to report this 
                  data using criteria that were developed by states and the federal government.
                  
                  
                  This will cause a spike in the cases and deaths data for some areas while we work to revise our historical data
                   with those probable cases and deaths.
                  

                  Sam

                  How to add modules

                  learning how to use browser developers window for css changes

                  1 Reply Last reply Reply Quote 1
                  • S Offline
                    sdetweil
                    last edited by

                    I posted an update to github today,
                    supports displaying US state county data

                    a little bit trickier on the data entry

                    counties:[ { ‘county_name’ : ‘state_name’ }, { ‘county_name2’ : ‘state_name2’} ]

                    on the chart only the county name is shown

                    Sam

                    How to add modules

                    learning how to use browser developers window for css changes

                    1 Reply Last reply Reply Quote 0
                    • D Offline
                      darbos
                      last edited by darbos

                      HI guys, thanks for making this! I am trying to show daily totales, I was trying to make it easy to see the totals for each day. However the graph is starting extremly high, see below. Can someone see what I am doing wrong?

                      THanks !

                      	```
                      
                      {
                      			module:"MyCovid19",
                      			position:"bottom_center",
                      			config:{
                      				states:['Arizona','Michigan','California'],
                      				line_colors:['red','white','blue'],
                      				chart_type:"cases",
                      				chart_title:"COVID Cases Reported Daily",
                      				ranges:{min:0,max:000,stepSize:100},
                                      backgroundColor: "transparent",
                      			    width: 600,
                      			    height: 500,
                      			    debug: true,
                      			    startDate: '06/01/2020'
                      			}
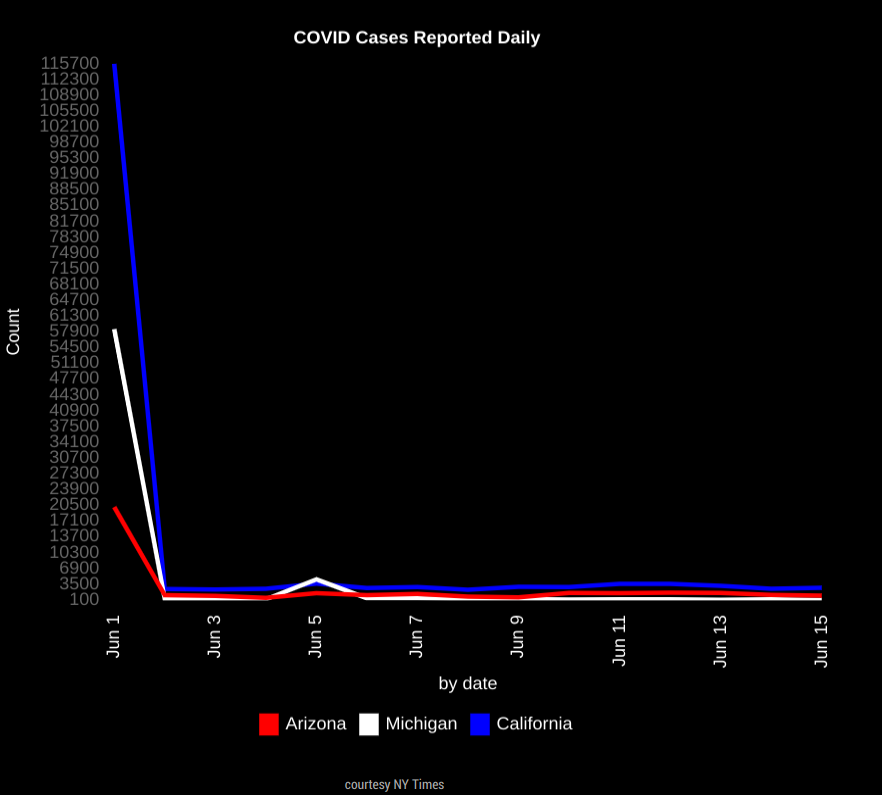
                      
                      ![Screenshot_20200616_185855.png](/assets/uploads/files/1592359395744-screenshot_20200616_185855.png)
                      S 1 Reply Last reply Reply Quote 0
                      • S Offline
                        sdetweil @darbos
                        last edited by

                        @darbos max is 0???

                        Sam

                        How to add modules

                        learning how to use browser developers window for css changes

                        D 3 Replies Last reply Reply Quote 0
                        • 1
                        • 2
                        • 5
                        • 6
                        • 7
                        • 8
                        • 9
                        • 7 / 9
                        • First post
                          Last post
                        Enjoying MagicMirror? Please consider a donation!
                        MagicMirror created by Michael Teeuw.
                        Forum managed by Sam, technical setup by Karsten.
                        This forum is using NodeBB as its core | Contributors
                        Contact | Privacy Policy