Read the statement by Michael Teeuw here.
Graph module
-
I think it will be really cool to have a module which will render a graph from the values you provide. Let’s say it will be a txt file or url with values put into rows. So the module will grab last N rows and render a graph.
All ideas I have for now is to create a transparent graph image myself and import it with the RandomPhoto module.
Im wondering do anyone here tried to create a custom graph for MM?
-
There a module of @qistoph
[card:qistoph/MMM-dynchart]
-
@roramirez said in Graph module:
There a module of @qistoph
[card:qistoph/MMM-dynchart]
Thank you! Yes, it looks pretty much like what Im looking for. But I could make a guess only throw the source code, because I could not make this module run. And it draws a static graph, not dinamic
-
Hi @feedparakeet,
The MMM-dynchart was a sample used to show some ideas.
A better example for you would be my Vitadock module:
https://github.com/qistoph/MMM-vitadockMaybe you can use it to base your module on.
If you could give a more detailed description of what you what to graph, I might be able to help you.
-
I’m logging room temperature and humidity to a csv file. How would I go about using the data to graph it to my mirror?
-
I’m using a bunch of graph already… why not using Grafana to record the data and the iFrame module to display them in your MM ?
-
@PointPubMedia said in Graph module:
I’m using a bunch of graph already… why not using Grafana to record the data and the iFrame module to display them in your MM ?
That’s a good idea actually. I don’t know what grafana is, will look into it. I might just use the temperature logging python code I have and add a graphing portion to it as well and then use the iframe module to display the graph. Sounds feasible on paper.
-
@PointPubMedia, thanks, Grafana looks good. I have it installed now to graph server’s cpu, network, e.t.c… Could you tell me please what do you use as a data source for Grafana to create custom graphs? I want to create bitcoin-usd graph, but I don’t know how can I put a data into Grafana.
And how do use put Grafana’s graph into iFrame module? Are there any tricks you can share? -
@feedparakeet I disable the authentication in Grafana so I can use direct link to a graph without a username/password!
In grafana, you can “export” a graph and it will give you a direct URL that you can use directly in an iFrame!
For datasource, currently I’m using a module in my home automation that already send data to grafana!
I need to work later on some unix script to send data directly in grafana!
-
@PointPubMedia Thanks! It worked!
Final setup is: php scripts which grab info from fixer.io (eur + usd) and btc-e.com (bitcoin), put them to InfluxDB and display with Grafana. Works like a charm!
Here is a screenshot from my MM. Looks beautiful in general. But still, few minor things to work on.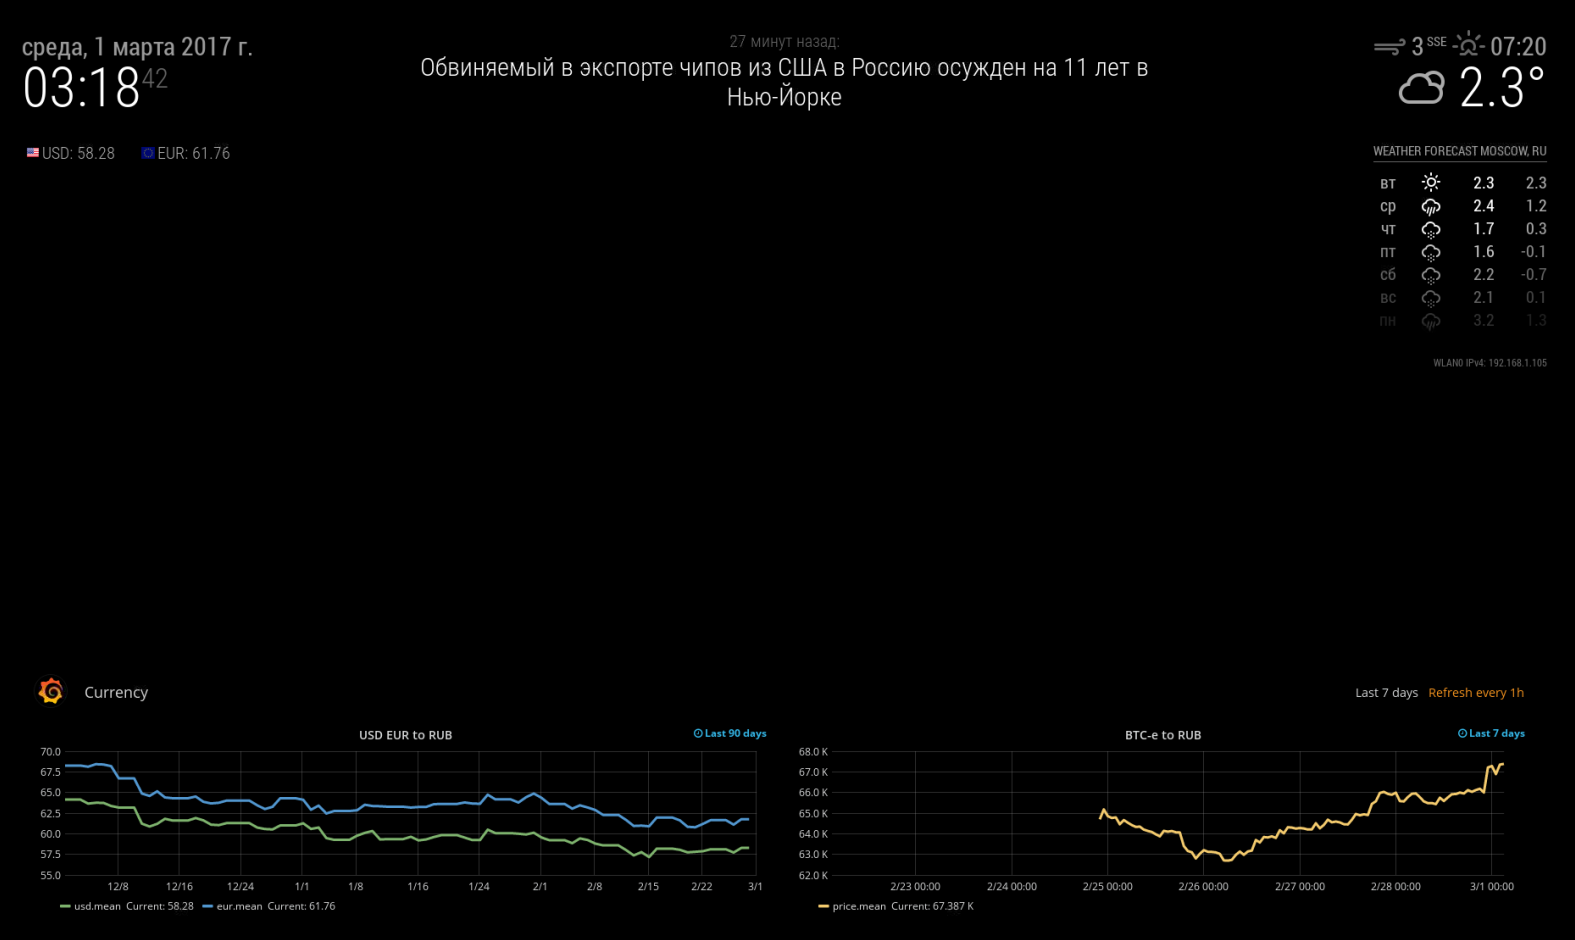
-
@qistoph, thank you, I really appreciate your response. It took me few weeks to understand how do graphs work and get what I need. Finally I did it with Grafana + InfluxDB + PHP scripts. Now I understand that each graph is very special and you need quite a few options to get it work like you want. So, Grafana is the solution for what I was looking for. Don’t think it will be easy to create a universal graph module to satisfy all my needs, like I thought it before. Thanks anyway!
-
@d3r It is absolutely possible with Grafana + iFrame module and a bit of magic lol
-
@feedparakeet How did you get grafana to use all black background?
-
@jalmaas I did it with a very rude way. I have changed all 141414 color to 000000 for background settings in /usr/share/grafana/public/css/grafana.dark.* files
Same way you can remove everything else, like Grafana logo. -
@feedparakeet Have you also seen the nasty empty square on the bottom of grafana iframe exports? I’m trying to get rid of it, but so far with no success. As well if you by chance found out how to get rid of the background grey without messing up with grafana CSS, that would be a great asset :)!
-
@nerakhon nope, I didn’t see any square really. The only thing I did is CSS change. You can select this square in Chrome browser and right click “View the source”, it will show you the certain part of the HTML, which you can later find in Grafana’s templates.
Don’t think there is any workaround to change background without changing CSS. -
@feedparakeet Thanks for sharing. I have really tried to remove the Grafana header but it wont work. Were able to replace the grey with black. Would it be possible for you to share your css files. Tried every setting in Grafana but it does not seem to be any good way to remove the header. Is the css files you have modified only for the snaphots and shared graphs?
-
@planet4 , what I did is:
cd /usr/share/grafana/public/css
find . -type f -exec sed -i.bak "s/141414/000000/g" {} \;
This command creates a .bak files with the original content of each modified file in case you would like to turn everything back.
Then, I enabled General-Dimentions-Transparent for each graph. And enabled General-Toggles-Hide controls for a dashboard.
My grafana’s header automatically goes away in few minutes if I don’t touch anything or move mouse. But even if I don’t see grafana’s grey header line, I can still see grafana’s orange-colored label.
Does your grafana’s grey header goes away if you don’t touch anything for 5 minutes? If not, then you should update to a new version. This feature is quite new. -
I wrote a little blog post, to describe how to use Influxdb and Grafana to build a weather chart. It’s available here.
-
@SvenSommer Very nice! I will try this as soon as I have reinstalled my old RPI. I have used the database to get info from home assistant so I can display graphs from my z wave sensor. However I am just wondering how it can display the graph as Grafana have a login page with password. Do I have to do something special in order to make this work.
Hello! It looks like you're interested in this conversation, but you don't have an account yet.
Getting fed up of having to scroll through the same posts each visit? When you register for an account, you'll always come back to exactly where you were before, and choose to be notified of new replies (either via email, or push notification). You'll also be able to save bookmarks and upvote posts to show your appreciation to other community members.
With your input, this post could be even better 💗
Register Login