Hi all,
I am currently a student living in a renewable energy home on my campus. We are capturing loads of data every minute (~1.5GB / month) and the data is being sent to a website called SiteSage, where we can monitor the home’s power usage.
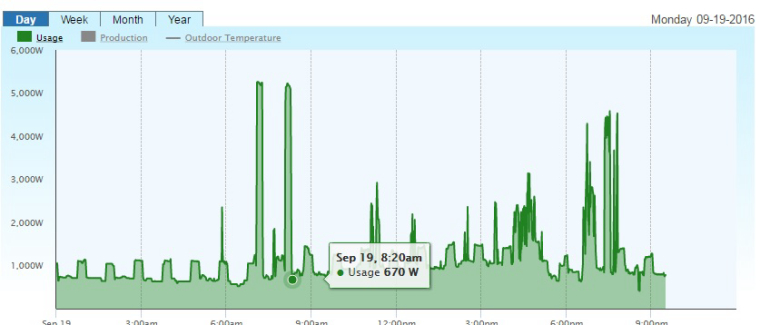
On the website, there is a chart(see below) that shows the daily (weekly, monthly or yearly) energy usage of the home. I would like to display the daily chart on my Magic Mirror, but I am not sure where to find the necessary tutorials to write my own module for the mirror that will accomplish my goal.
Some general questions I have.
- Is it possible for me to create a module that can speak to the SiteSage website and grab the chart from the website?
- Are there any tutorials for writing modules from scratch?
Thanks for your responses - this is a great community!