Read the statement by Michael Teeuw here.
MMM-GrafanaCharts and MMM-GrafanaGauges: Display you data with Charts and Gauges. Beautifully.
-
Description:
Two little modules for the Magic Mirror to include beautiful graphics generated with grafana.
MMM-GrafanaCharts
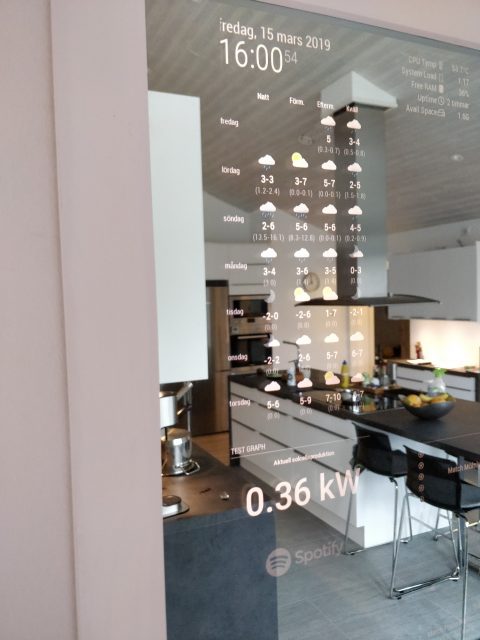
It’s for your graphs! The data that’s currently displayed on my mirror using the MMM-GrafanaCharts is a weather forecast for the next two days.
If you’re interested in building you own weather chart, check out my blog post Programming your personal weather chart.MMM-GrafanaGauges
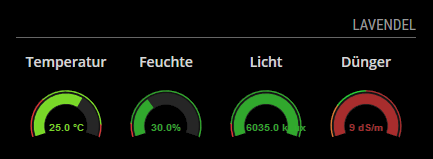
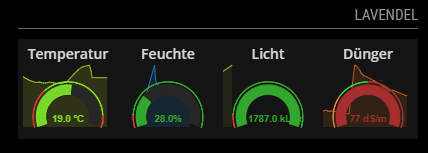
Gauges are extremely helpful to monitor individual values and their deviations from the nominal value. With the MMM-GrafanaGauges vital values of my plants are displayed on the mirror.
Screenshots:
Download
[card:SvenSommer/MMM-GrafanaChart]
[card:SvenSommer/MMM-GrafanaGauges]
MMM-GrafanaChart- Version 1
- Initial release
- Showing charts provided by grafana
MMM-GrafanaGauges- Version 1
- Initial release
- Showing gauges in a row provided by grafana
-
Tried this and it works fine. The simple way to show temperatures is this:

The more complicated but more fun way is this:

I have tried to use Grafana before but had problems with headers etc. Thanks to this module most problems are solved.
I get the data from my z Wave sensor http://aeotec.com/z-wave-sensor. This is connected to a raspberry running home assistant. On another raspberry I use influxdb and grafana. Home assistant is sending influx data to this PI. On the thirs Raspberry i run Magic mirror and the result is displayed. The only issue is that in dark light you can see the border and background in the graph even if it is set to black. Maybe this is just a feuture of the mm and the screen.
I also tried to use the same module to display if the door is locked or unlocked. I also get the data from home assistant.
-
Regarding the black background I think it is solved. Maybe there was some kind of cache problem. After chaning the css files it looks perfect.
-
@planet4 good news!
Can you please share which CSS file, and what you edited? -
Can i also show there other temperatures?
Like temperatures from 1-wire Dallas sensor or from a http site?Issues With MMM-WatchDog known?
https://forum.magicmirror.builders/post/29827
Useful for PIR-Sensor: https://forum.magicmirror.builders/post/21299
-
@fox
Short answer: No, not the direct way.Long answer: You need to write your temperature data into a database which is connected with Grafana. Then you can use this module to display your graph created by grafana.
One possible solution: This tutorial shows an example, on how to store weather data from an external source in a local influxdb database, which is connected to grafana.
You could reuse the example code an edit it, to get your data stored in a influxdb database. -
@SvenSommer said in MMM-GrafanaCharts and MMM-GrafanaGauges: Display you data with Charts and Gauges. Beautifully.:
@fox
Short answer: No, not the direct way.Long answer: You need to write your temperature data into a database which is connected with Grafana. Then you can use this module to display your graph created by grafana.
One possible solution: This tutorial shows an example, on how to store weather data from an external source in a local influxdb database, which is connected to grafana.
You could reuse the example code an edit it, to get your data stored in a influxdb database.i will try your possible solution :) Thank you
edit:
thanks for sharing the link.
I installed influxDB and grafana as written on your page.
I also added the datasource to grafana.You mean i have to update this script?
importForecast.jsIssues With MMM-WatchDog known?
https://forum.magicmirror.builders/post/29827
Useful for PIR-Sensor: https://forum.magicmirror.builders/post/21299
-
@fox Yes, this script is responsible for getting the data into the database.
If you would like to show other data with Grafana, you need to save the data you get from your sensor.
-
How do you manage credential to get access to grafana?
Thanks in advance. -
How to install Grafana? Does that debian work fine on rpi? I am confused since the architecture is different and I think the packages should be different as well.
I know its a very stupid question, but please help
-
@yours.mukul
Yes just follow these instructions:
http://docs.grafana.org/installation/debian/ -
@sceletus
Enable authentication in the [http] section of the configuration file /etc/influxdb/influxdb.conf :[http] enabled = true bind-address = ":8086" # change to a specific interface if needed auth-enabled = true # will enforce authenticationeverything is described in the tutorial on http://robstechlog.com/2017/06/30/personal-weather-chart-module/
-
@planet4 Are you able to provide steps on how you managed to update the CSS file to match the black background of the MM?
-
@hunty1980 I used this guide https://forum.magicmirror.builders/topic/1675/graph-module/18
-
@SvenSommer Have not used this module for a while but have now reinstalled Grafana and would like to try it again. However I can not remember how to solve the login to Grafana. I think I opened it up as public the last time but is not an option now. At the moment the mirror just shows erroe as it can not login to the Grafana dashboard. Please advise.
-
I was able to solve the login issues but now its just black. Maybe this module does not work with the new version of Grafana?
-
@planet4 Hey, I just tried it with the actual Grafana v6.0.1 (commit: 0c44a04)
It worked for me without any adjustments.Maybe I can support you, to set it up.
-
@SvenSommer Thanks for replying. I was actually able to solve it but with version 6 of Grafana black background is more of a trouble. Wrote a short post about this as well.
http://www.planet4.se/grafana-in-magic-mirror/
I am now able to show my Solar production on my mirror. 0,36kW. Will post this in the show my mirror as well. Thanks.
-
@planet4 thanks
your post helped me half way
im using home assistant to host grafana so i needed to create an org called home assistant. -
@teitlebot I am using Home Assistant as well but Grafana is not used as an add-in on Hassio. I have it on a separate docker container. However I gave up Grafana in the end. It was to much problems. Now I use MQTT to get all information I want from Home Assistant to my Mirror. Like this:
Hello! It looks like you're interested in this conversation, but you don't have an account yet.
Getting fed up of having to scroll through the same posts each visit? When you register for an account, you'll always come back to exactly where you were before, and choose to be notified of new replies (either via email, or push notification). You'll also be able to save bookmarks and upvote posts to show your appreciation to other community members.
With your input, this post could be even better 💗
Register Login