Read the statement by Michael Teeuw here.
MMM-Chart - View your graphs on your Mirror
-
@Snille :) thanks! How do I add them? Can you send me the php script you are using? It will be a big help for me ! Thx
-
Hi, this is a part of my php pickup/conversion script…
I hope this can help you. :)// Get all the data from the database. foreach ($ids as $i => $idnum) { //Fetches the data from MYSQL via PDO. $values[] = getvalues($dbservername, $dbname, $dbusername, $dbpassword, $deftable, $defsensoridcolumn, $max, $ids[$i], $sort); } // Initialize the array. $outarray = array(); $first = 0; foreach ($values as $key => $value) { $position = 0; foreach ($values[$key] as $i => $value) { If ($first == 0) { $outarray[$position][] = $values[$key][$i]["time"]; } $outarray[$position][] = floatval($values[$key][$i]["value"]); $position++; } $first++; } // Make it JSON. $json = json_encode($outarray); // Print it. echo $json; -
@Snille Thanks! Will try this ! I will let you know the results :)
-
Finally it’s working :) Thanks for the help. I use googlespread sheet, csv export, and php to convert it to json. If some somebody interested I can give some help.
-
Hy it was quite hard to get the dht22 values showing up with your chart.
finally i got the php script working to fetch mysql data to your json format:
//your code here //open connection to mysql db $connection = mysqli_connect("localhost","logger","password","temperatures") or die("Err$ //fetch table rows from mysql db $sql = "select * from temperaturedata"; $result = mysqli_query($connection, $sql) or die("Error in Selecting " . mysqli_erro$ //create an array $emparray = array(); $position=0; while($row =mysqli_fetch_assoc($result)) { $emparray[$position][] = $row['dateandtime']; $emparray[$position][] = $row['temperature']; $emparray[$position][] = $row['humidity']; $position++; } echo json_encode($emparray); //close the db connection mysqli_close($connection); -
Hy i also have troubles with the real time chart.
it shows the chart only for 0,5s and then it will disapear?
do you ever had this issue?
and is it possible to ad more ticks on the x-axis?
if i display temp data from a day, it will only show two ticks -
Good day all,
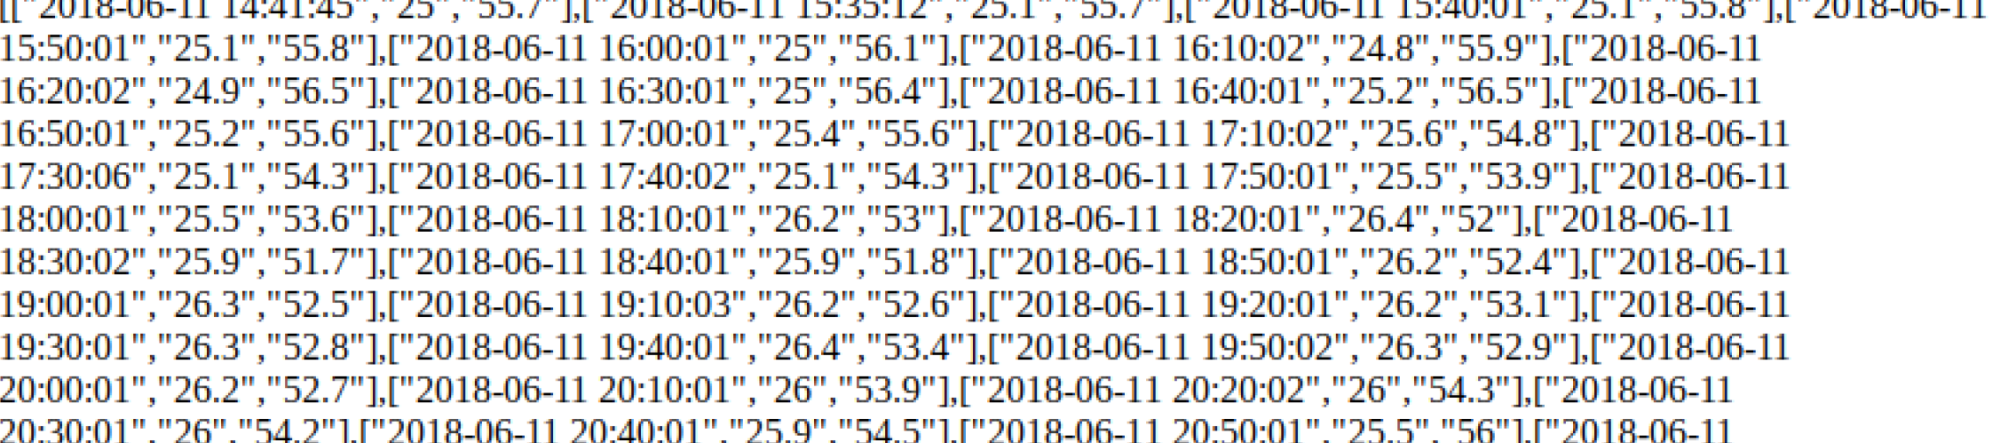
i’m able to see my data locally on my php file, but unfortunately i cannot see the graph on my MM page…This is what i see when i open my index.php file:
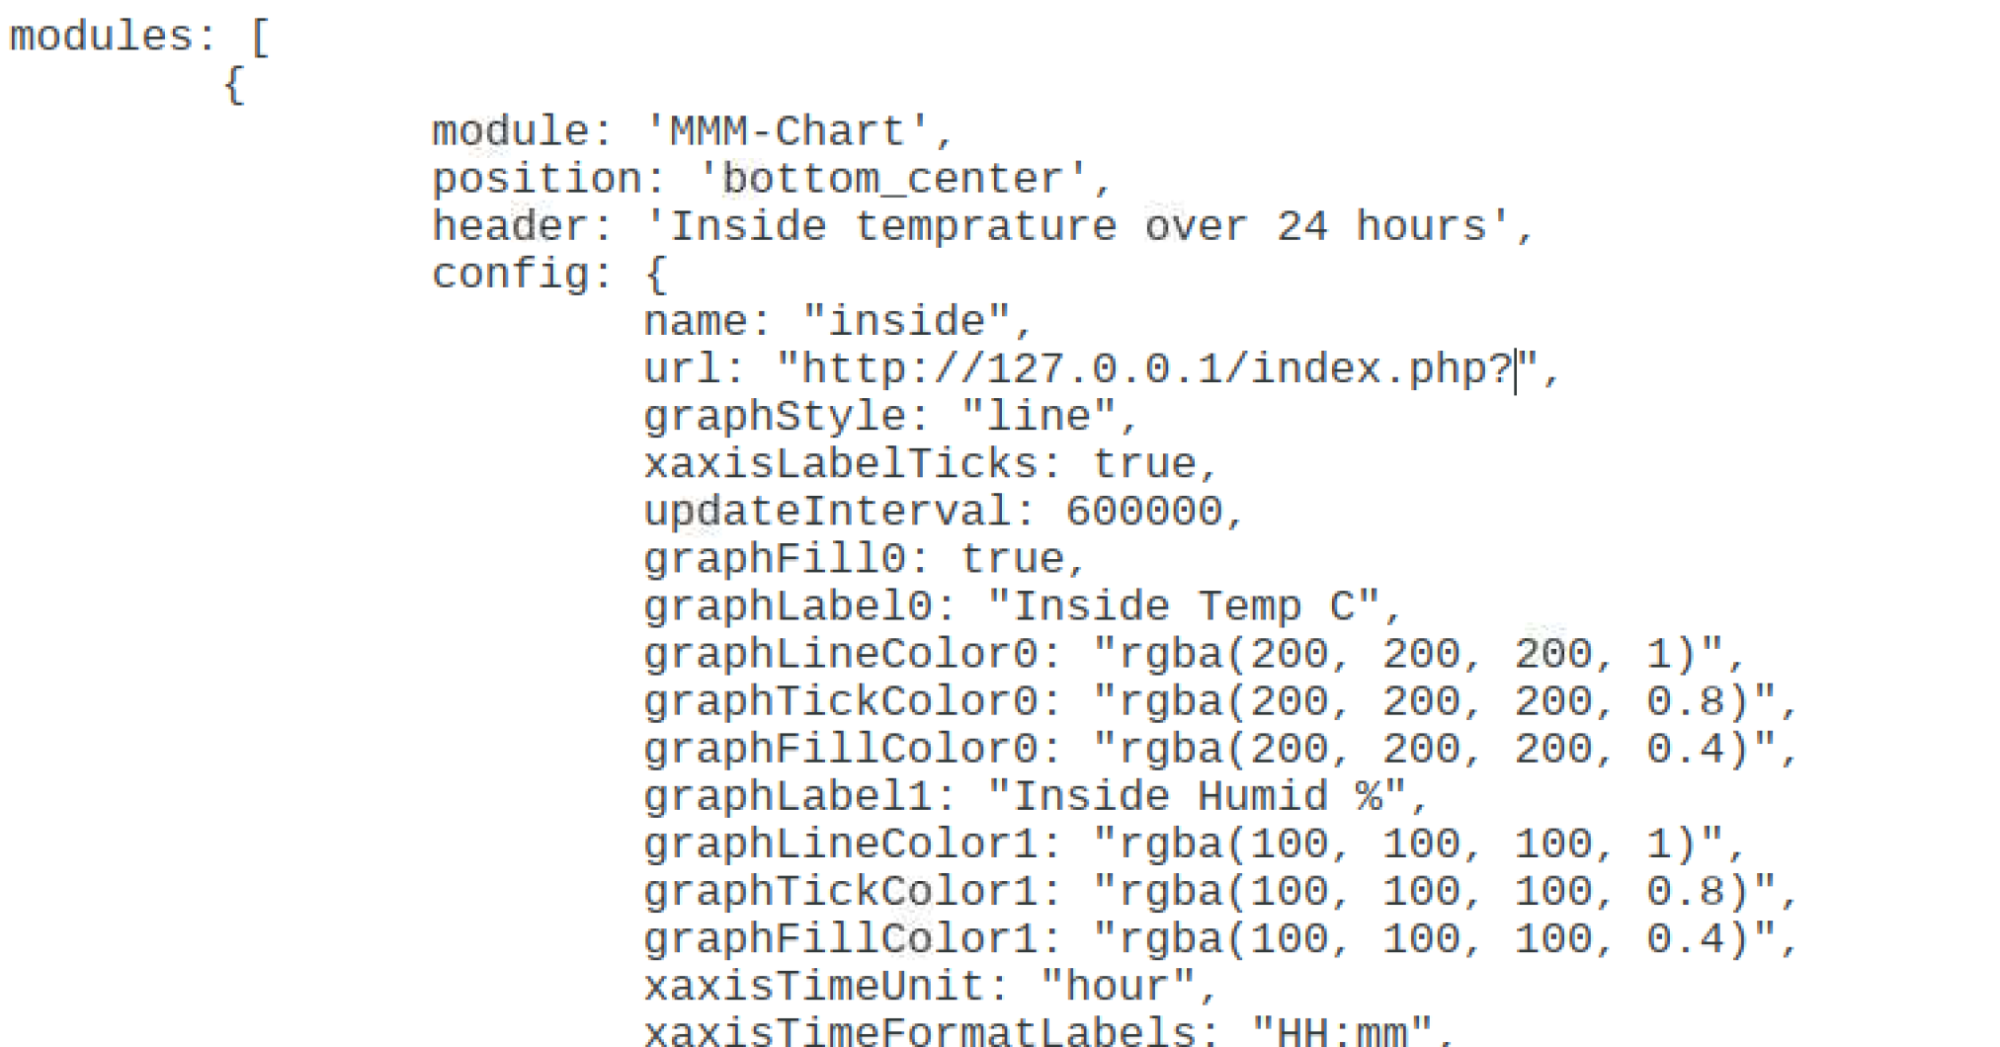
This is the config file:
And this is what i see in my MM page:

Any suggestion? Consider that i’m not an expert…
Thanks.
Regards.
-
(
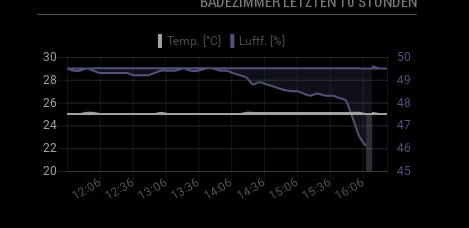 image url)
I have the issue that the graph is jumping back to the beginning.
Has anyone else this issue?
@zazzo hm strange your data looks code…
-
Hy i solved the issue with jumping values.
you are deleting the y axis values in the file mmm-chart.js
but not the label dataarray.
i added the line:
this.chartData.labels = [];
at #296 and now i have fixed the jumping value issuei also added the suggestedMin/Max parameter and to change the line chart to a stepped line chart
-
@logen563 Hi. I am interested how you did this? Would like to display graph. Data is from an xml file that I download daily.
-
@ricq you have to convert the xml to the json format.
i have now build a python script which provides the data from my sensors.
or you build a php script…
-
This post is deleted! -
How do i turn my MQTT temperature data from Mosquito into jason data providing me with a url for this module? or is there a way to get your module to read an mqtt topic?
-
@zazzo how did you create that php file in the first place? I’m new to this and really struggling. thanks in advance
-
@turntablist2 u can use any language u like. I created a conversion script in JavaScript for one person.
It’s knowing your data, and how you would organized it into items you would chart.
Draw the chart on paper, what are the x and y axis?, how do you get your data into points along the line.
Hello! It looks like you're interested in this conversation, but you don't have an account yet.
Getting fed up of having to scroll through the same posts each visit? When you register for an account, you'll always come back to exactly where you were before, and choose to be notified of new replies (either via email, or push notification). You'll also be able to save bookmarks and upvote posts to show your appreciation to other community members.
With your input, this post could be even better 💗
Register Login