Read the statement by Michael Teeuw here.
[Help!] svg Graph in module MMM-Strava
-
HI all,
I was trying to add an svg graph to the MMM-Strava module made by @ianperrin.
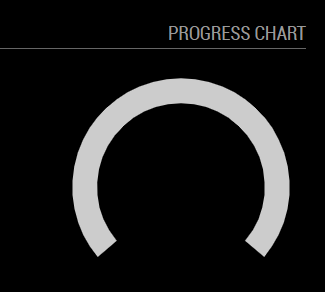
The idea was to have a yearly or 4-week goal for an activity and having a progress bar showing how much of this goal you reached already .
So I wanted to implement this progress bar:
https://codepen.io/davatron5000/pen/jzMmMESince we’re bound to Javascript from my understanding I have to set the DOM elements and attributes in the .js file.
I’ve tried it like this:createProgressBar: function() { var progressWrapper = document.createElement("div"); //this.log("Created Progress Bar Div") progressWrapper.className = "progressBarDiv small"; var svg = document.createElement("svg"); svg.className = "progressSVG"; svg.setAttribute("xmlns", "http://www.w3.org/2000/svg"); svg.setAttribute("height", "300px"); svg.setAttribute("width", "300px"); svg.setAttribute("viewBox", "0 0 300 300"); svg.setAttribute("data-value", "40"); progressBG = document.createElement("path"); progressBG.className = "bg"; progressBG.setAttribute("stroke", "#ccc"); progressBG.setAttribute("d", "M41 149.5a77 77 0 1 1 117.93 0"); progressBG.setAttribute("fill", "none"); svg.appendChild(progressBG); progressWrapper.appendChild(svg); return progressWrapper; },and this is the css:
.MMM-Strava .progressBarDiv {
    display: block;
    width: 300px;
    height: 300px;
}

.MMM-Strava svg {
    width: 300px;
    height: 300px;
}

.MMM-Strava .bg {
    will-change: auto;
    stroke-width: 20px;
    stroke-miterlimit: round;
    transition: stroke-dashoffset 850ms ease-in-out;
}

.MMM-Strava .progressWrapper {
  display: grid;
  justify-content: center;
  align-items: center;
}
Function is called and the wrapper div is returned without errors, but all i get is an empty div 300x300. The svg has a height/width of 0 and does not show anything.
What have I overseen.Any help highly appreciated!
-
@lavolp3 I found that the only way to create an SVG via the DOM was to use
document.createElementNS. There’s a helper function (poorly namedgetNode) in the current master branch which supports the creation of an SVG tag with attributes (e.g.getNode("svg", {width: 115, height: 68, class: 'chart'})However, I’ve recently been implementing new authentication flow in the develop branch. Alongside that, I’ve switched to using nunjucks templating. There’s quite a few changes, including the
chartmode now supporting theperiodoption (i.e.recent,ytd) and the ability to add multiple instances of the module to the mirror which could (should?) make implementing new views easier.My suggestion would be to add a new mode (
progress) to the module along with a new template (templates\MMM-Strava.progress.njk) and start from there.Let me know how you get on and I can assist where possible.
-
@ianperrin said in [Help!] svg Graph in module MMM-Strava:
However, I’ve recently been implementing new authentication flow in the develop branch.
See https://forum.magicmirror.builders/topic/457/mmm-strava/37 for more details on the new beta version ;)
-
@ianperrin Thanks Ian. I have seen what you’re doing in deelopment branch and currently just trying out locally. Will try to adept later on. Nunjucks template shouldn’t be a problem I guess.
As soon as I have something I’ll send a PR and we can discuss how valuable it really is.
I have been struggling with your approach a bit using “element-creating” functions and returning one element in each function.
As a JS beginner, it was difficult for me to actually ADD a div/element to the body itself regardless of the users’ choice for a table or a chart. I needed first to substitute one of the other ones with a new function.
However it’s very much fun :-) and I’m learning a lot -
@lavolp3 - no worries. I’ve created a branch to develop this feature. Take a look at https://github.com/ianperrin/MMM-Strava/tree/feature/progress_chart
Once you checkout the branch, add/use the following configuration with either the legacy
strava_idandaccess_tokenoptions, or the newclient_idandclient_secretoptions:{ module: "MMM-Strava", position: "top_right", header: "Progress Chart", config: { activities: ["ride"], period: "ytd", mode: "progress" }, },
I haven’t yet implement the animated path to show the progress against the goal. ;)
-
@ianperrin Ian, I haven’t seen your latest reply, sorry, but meanwhile I’ve learnt how to deal with the templates and am implementing the progress bar myself.
The nunjucks environment makes it much easier for me in the end.
Look for a PR soon :-)
Thanks again for your work on this! Having much fun with the API and would like to bloat the module much further. (–>motivation for summer)
