Read the statement by Michael Teeuw here.
Mycovid19 graph doesn't show on webpage through Dataplicity
-
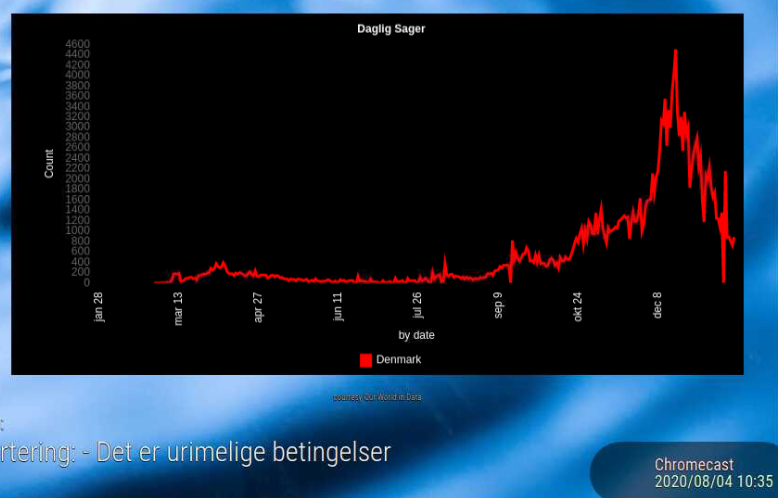
The graph works and shows fine on the monitor, which is connected directly to my RPI, but does not show on my Dataplicity webpage. The only thing there is, is the “
MyCovid19 Loading data for chart "Cases"”. Everything else works fine.
From my dataplicity webpage:

From VNC Viewer:

I’m lost, and do not know what to do to fix it -
@Blauenfeldt what is a dataplicity web page?
-
@Blauenfeldt the charting tool is drawing directly to the glass
-
@sdetweil Dataplicity is a “device forwarding” program. I install their program on the pi, then it is forwarded to their service. I can then go to their website, and remote control it via shell. I also get a link (something.dataplicity.io), where I can see the what it shows. For me, it’s basically port forwarding with remote shell, and I get to use letters instead of ip address.
Found out it took long time for it to load, but i works now, kinda. I found out, that with the “startDate” added, i won’t load at all, even local.
It won’t load with:
startDate: 10/28/2020,
But will, but with wrong start date with:
StartDate: 10/28/2020,
Jan 28 is the first day it shows. -
Never mind.
Found out, that I had to dostartDate: "10/28/2020",
