Read the statement by Michael Teeuw here.
MMM-COVID19-AMPEL (focus on Germany)
-
Hi,
this is something especially for the German users here. The Plugin shows the Incidence Value of COVID in a coloured way in order to see which restrictions is in place at the moment. I added this module for my Mirror and would like to share this with you. Version is still Alpha, but seems to work for me.
In Germany the public restrictions are based on a level of new infections within 7 days per 100.000 people. This is called the incidence value. Based on this figures the alert level and restrictions are given
Green smaller or equal than 30 Incidence Value (New infections in 7 Days / 100.000 Population)
Yellow > 30
Red > 50
Dark-Red > 100You can find the repository here:
https://github.com/magic21nrw/MMM-COVID19-AMPEL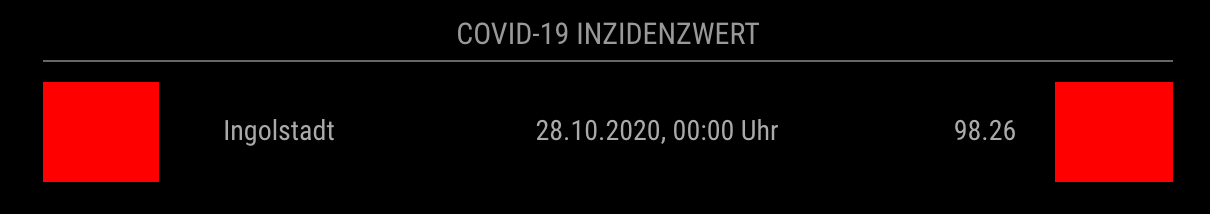
I think it is pretty self explanatory and lightweight because update frequency is very low (The values only get an update once a day so there is no need to poll frequently.)
Daniel
-
Thanks for sharing that module! I‘ll give it a try later.
-
Thanks for sharing. Works fine
Is it possible to show more than one Area? -
Not at the moment as I made it only for the purpose of displaying one place (where I live ;-) ) at a time. But the change would not be so huge as it is pretty easy to loop through the results in the object.
I will think about it and have a look later. Anyone else voting for this feature?
-
I vote for this feature!
But isn’t it possible to use the module twice? Rename the folder etc which is described several times here in the forum?
Greetings
Thomas (who needs it for Bonn and Ratingen) -
cool, habe es auch im Spiegel, :-) Top!
-
@thgmirror That should work. I’ve done that with other modules, too.
-
No need to do that. I uploaded a new Version of the module. Just replace the CityID with the “223” number with an array [“223”,“221”,“225”] and it will show the different cities below each other.
Daniel
-
@magic21nrw great! Thanks!
-
@magic21nrw Great Working Fine!!
-
@magic21nrw hi ,Vorschlag von mir du kannst noch ein Pfeilchen hoch und runter zum Vortag setzen. Dann bekommt man auch ein Gefühl , wo die Zahlen aktuell hingehen.
-
It would be nice to have this but the data source only supports actual data with a timestamp.
If I would remember the old value it would show the arrow only after the first update at midnight when new data is available. This means when rebooting the mirror once at night would reset the old value.
Any idea how to make a history? I could write the values in a file once it gets new values but this seems a bit of overkill for it…
Any ideas how to solve this easily?
-
Hey, nice work ! Is it possible to merly see the value instead of Time-stamp and City?? a la “red - Incidense-value - red”
-
@magic21nrw hi ihabe gesehen, das die Zahlen im log auch stehen, vielleicht da auslesen?
-
Excellent work, thanks for that!
As a suggestion, maybe you could add the timestamp on the header instead of close to each city? For users having more than 1 city, there is no need to see the timestamp more than once. -
@lucas781 I’d second that proposal.
-
I updated the module to reflect the change with the update time-stamp. You got two new configuration items now:
showUpdateDateInHeader: true, //Show update date in header
showUpdateDateInRow: false, //Show update date in each row
so you can customise it as you like. Defaults are displayed above.
Ich bekomme von der Datenabfrage immer nur die IST Werte. Im Log wird einfach was weg geschrieben, aber keine abfragbare Historie angezeigt. Das wird ein wenig schwieriger.
-
@magic21nrw Thank you so much! It is even better now
-
@magic21nrw Sieht viel besser aus im Header ! :-)
-
Kann man sich auch die Werte von Deutschland anzeigen lassen und interessant wäre der Vergleich zum Vortag.
Hello! It looks like you're interested in this conversation, but you don't have an account yet.
Getting fed up of having to scroll through the same posts each visit? When you register for an account, you'll always come back to exactly where you were before, and choose to be notified of new replies (either via email, or push notification). You'll also be able to save bookmarks and upvote posts to show your appreciation to other community members.
With your input, this post could be even better 💗
Register Login