Read the statement by Michael Teeuw here.
MMM-forecast-io -- Localized up to the minute weather
-
@bminer1 it seems that you are trying to
pullinstead ofclone(and git is not globally configured on your system and doesn’t recognize you)try running this command instead:
git clone https://github.com/dmcinnes/MMM-forecast-io.git -
noob mistake. Installed now. Thanks!!
I feel like an idiot. This machine will not beat me!! -
I’m not getting any graph for precipitation. Will it only be there if there is rain/snow in the next x amount of hours?
-
@bminer1 I believe that default setting is not to show precipitation graph, unless there is a prediction for rain or snow in next hour. I think it takes data from
minutelyweather forecast supplied by DarkSky. -
I love the simplicity of MMM-Forecast.io, and yet wanted more from the graph. The default graph seems to be aimed at minutely weather for the near future.
Earlier in this thread there was a graph example from dmcinnes’s mirror:
https://github.com/jangellx/MagicMirror#important-installation-note
Sadly, the code from that mirror’s graph is a totally different approach than the main branch of forecast.io. Stealing code was not an option, so I had to write a bunch from scratch.For my own use, I’ve rewritten a lot of the graph- and added in a few goodies, like:
-Graph now shows 36 hours of forecast
-Day/night shading in graph
-Temperature line in graph with labels
-Precip intensity graph is now blue.
-Graph has freezing blue line, and hot 80 degree line.
-Wind speed is an option to turn on/off
-Sunrise/Sunset is an option to turn on/off
-Included notes for easy color icons, via “Color-icons.md”
Feel free to play with my branch:
https://github.com/FlatPepsi17/MMM-forecast-io/tree/FlatPepsi17-GraphUpgradeKnown limitation: non-Fahrenheit units will probably look funny, as the graph scaling & hot/cold lines are not unit aware.
-
@ooom416354 sorry about taking so long to reply! You can shrink the module a bit by using the MagicMirror’s size classes. I normally have mine set as “small”.
{ module: 'MMM-forecast-io', classes: 'small' ... } -
Hello everyone,
I’ve recently updated the module fixing/adding a couple things:
- Fixes an issue that made the top of the curve appear off the graph during a heavy storm.
- Adds
alwaysShowPrecipitationGraphto always show the precipitation graph. - Adds details on getting the geolocation working by setting the
GOOGLE_API_KEY.
Use
git pullin your module to update.Enjoy!
Doug -
@FlatPepsi Looks awesome! I particularly like the day/night shading in the graph.
-
@dmcinnes @FlatPepsi Love the module and the changes to it so I forked it. Also made a couple of changes to it (revert back to 24h, hot/freeze lines in metric and have a couple more visual changes I’d like to do).
Anyway, this topic is old so hope you guys still see this now. Could you help me out or point me in the right direction on how the forecast table and bars is build up?
On my mirror the days and bars seem to have shifted one column to the left and do not line up nicely under de graph
@FlatPepsi has it like this:

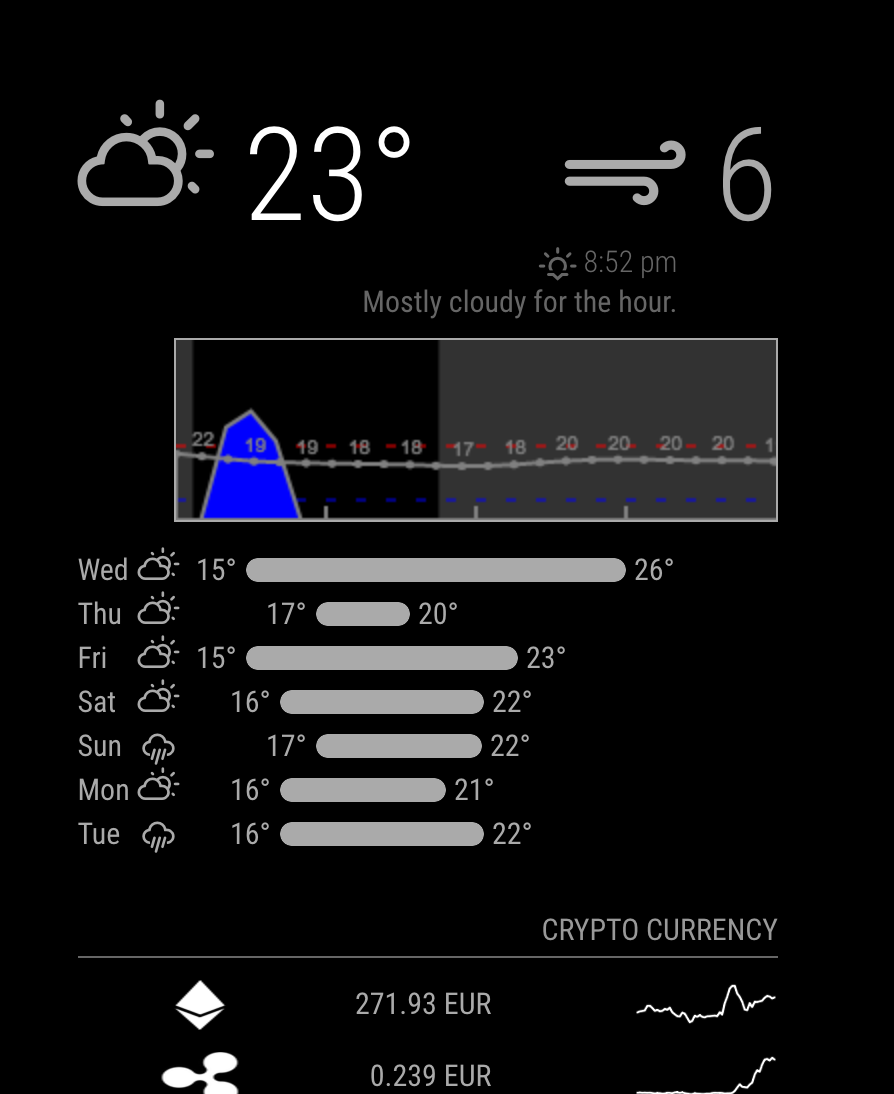
and mine is like so:

Also the sunset/sunrise and line below are “moved” to the left. Now I did a diff between @FlatPepsi and @dmcinnes code and the table build seem to be the same.
Hope you can help me or point me in the right direction to get it nicely lined out underneath the graph.
-
@jinjirosan - The temperature bars auto scale based upon the width of the rest of the module. I suspect some other changes you’ve made have caused the module to get wider, so you’re looking at a side effect and not a cause.
It might also be a screen resolution – the crypto currency module underneath in your screenshot is wide as well. I’m using a crummy small monitor, and have very narrow margins.
I love that someone else is picking this up and running with this module. Looks good!
