Read the statement by Michael Teeuw here.
MMM-forecast-io -- Localized up to the minute weather
-
@phrazelle the css is located in the magicmirror vendor folder
-
@strawberry-3.141 Thanks for the info!
After looking through there, it looks like the module pulls the icons as a font file. I believe that would mean that CCS customization would be overall to each displayed character. So there would be no way to color segments of each character (like an orange sun poking out from a grey cloud) because the stylization would apply to the character as a whole.
Am I assessing at that correctly?
-
Great module!! One question, is there anyway to make the length of the temperature bars a bit smaller? I suppose because the NY weather is so erratic right now it is making the bars wider but was just curious if I can shrink them a bit to save some space. thanks!
-
also it could just be me but I keep seeing the rain icon next to the temperature even though there’s no rain in the forecast for today (the small icon by the days of the week shows nothing but sun). Anything I can do to check that icon to see if it is an issue?
-
Im getting the below when i try to install:
pi@raspberrypi:~/MagicMirror/modules $ git pull https://github.com/dmcinnes/MMM-forecast-io.git
From https://github.com/dmcinnes/MMM-forecast-io
 * branch            HEAD       -> FETCH_HEAD

*** Please tell me who you are.

Run

  git config --global user.email "you@example.com"
  git config --global user.name "Your Name"

to set your account's default identity.
Omit --global to set the identity only in this repository.

fatal: empty ident name (for <pi@raspberrypi.(none)>) not allowed
pi@raspberrypi:~/MagicMirror/modules $
How do i fix this in order to install?
Note from admin: Please use Markdown on code snippets for easier reading!
-
@bminer1 it seems that you are trying to
pullinstead ofclone(and git is not globally configured on your system and doesn’t recognize you)try running this command instead:
git clone https://github.com/dmcinnes/MMM-forecast-io.git -
noob mistake. Installed now. Thanks!!
I feel like an idiot. This machine will not beat me!! -
I’m not getting any graph for precipitation. Will it only be there if there is rain/snow in the next x amount of hours?
-
@bminer1 I believe that default setting is not to show precipitation graph, unless there is a prediction for rain or snow in next hour. I think it takes data from
minutelyweather forecast supplied by DarkSky. -
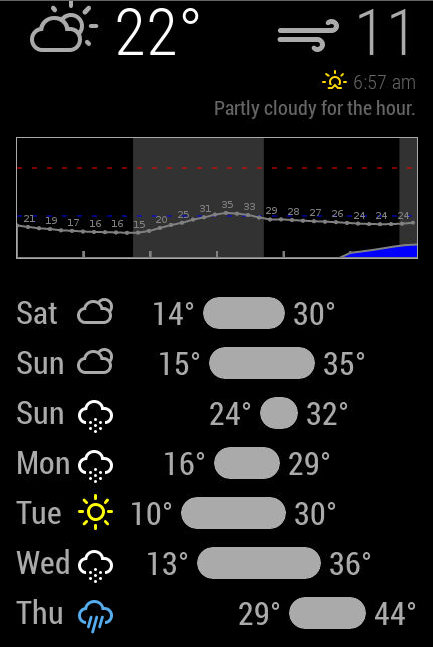
I love the simplicity of MMM-Forecast.io, and yet wanted more from the graph. The default graph seems to be aimed at minutely weather for the near future.
Earlier in this thread there was a graph example from dmcinnes’s mirror:
https://github.com/jangellx/MagicMirror#important-installation-note
Sadly, the code from that mirror’s graph is a totally different approach than the main branch of forecast.io. Stealing code was not an option, so I had to write a bunch from scratch.For my own use, I’ve rewritten a lot of the graph- and added in a few goodies, like:
-Graph now shows 36 hours of forecast
-Day/night shading in graph
-Temperature line in graph with labels
-Precip intensity graph is now blue.
-Graph has freezing blue line, and hot 80 degree line.
-Wind speed is an option to turn on/off
-Sunrise/Sunset is an option to turn on/off
-Included notes for easy color icons, via “Color-icons.md”
Feel free to play with my branch:
https://github.com/FlatPepsi17/MMM-forecast-io/tree/FlatPepsi17-GraphUpgradeKnown limitation: non-Fahrenheit units will probably look funny, as the graph scaling & hot/cold lines are not unit aware.
-
@ooom416354 sorry about taking so long to reply! You can shrink the module a bit by using the MagicMirror’s size classes. I normally have mine set as “small”.
{ module: 'MMM-forecast-io', classes: 'small' ... } -
Hello everyone,
I’ve recently updated the module fixing/adding a couple things:
- Fixes an issue that made the top of the curve appear off the graph during a heavy storm.
- Adds
alwaysShowPrecipitationGraphto always show the precipitation graph. - Adds details on getting the geolocation working by setting the
GOOGLE_API_KEY.
Use
git pullin your module to update.Enjoy!
Doug -
@FlatPepsi Looks awesome! I particularly like the day/night shading in the graph.
-
@dmcinnes @FlatPepsi Love the module and the changes to it so I forked it. Also made a couple of changes to it (revert back to 24h, hot/freeze lines in metric and have a couple more visual changes I’d like to do).
Anyway, this topic is old so hope you guys still see this now. Could you help me out or point me in the right direction on how the forecast table and bars is build up?
On my mirror the days and bars seem to have shifted one column to the left and do not line up nicely under de graph
@FlatPepsi has it like this:
and mine is like so:
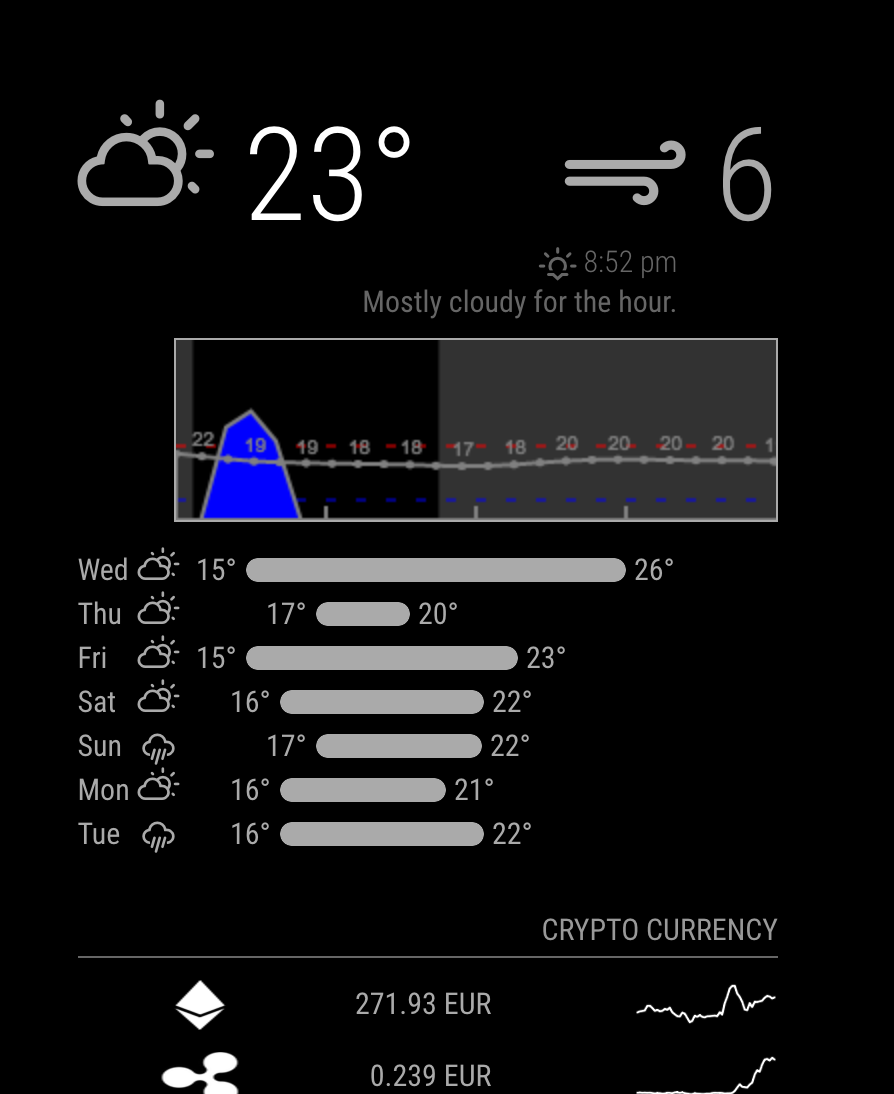
Also the sunset/sunrise and line below are “moved” to the left. Now I did a diff between @FlatPepsi and @dmcinnes code and the table build seem to be the same.
Hope you can help me or point me in the right direction to get it nicely lined out underneath the graph.
-
@jinjirosan - The temperature bars auto scale based upon the width of the rest of the module. I suspect some other changes you’ve made have caused the module to get wider, so you’re looking at a side effect and not a cause.
It might also be a screen resolution – the crypto currency module underneath in your screenshot is wide as well. I’m using a crummy small monitor, and have very narrow margins.
I love that someone else is picking this up and running with this module. Looks good!
-
Thx for the quick reply! Yes, the crypto currency module also scales based on the width of the “top right” column of the mirror. Still have to fix that but up until now the other modules above and below were of narrower width.
Screen resolution could be it, I’m using a 24" monitor at native 1080p. I do remember that the sunrise/sunset, hourly forcast line above the graph and the days forcast below the graph were shifted to the left before I made changes but I’ll check to make sure.
Is there a way to “fix” the sunset/sunrise/hourly and the forecast days/bars in place instead of having it auto-scale?
-edit- : I freshly pulled @FlatPepsi and the days/bars and the sunrise/sunset/hourly forecast are shifted to the left as shown in my original picture.
Also pulled @dmcinnes repo and that seems to outline the way I like to see it. Looking at a diff between the files the table generate section seems the same.The mirror project for me is to work on my coding skills as well (which do need a lottttttt of work :-) ) so pls bear with me when I ask something that might be obvious :-)
-
Got it :-)
Playing around with the Chrome inspector and fiddling with additional CSS classes, have it lined up nicely now.
Now the hard(er) part, the visualization changes.
-
I cannot for the life of me get this to work it keeps saying that there is an error in the config file. I will have it Exactly as others have it with only my darkskyspi key being diffrent and still get the error .
magicmirror@2.1.2 start /home/pi/MagicMirror
sh run-start.shStarting MagicMirror: v2.1.2
Loading config …
WARNING! Could not validate config file. Please correct syntax errors. Starting with default configuration.
Loading module helpers …
Initializing new module helper …
Module helper loaded: updatenotification
No helper found for module: helloworld.
All module helpers loaded.
Starting server on port 8080 …
Server started …
Connecting socket for: updatenotification
Sockets connected & modules started …
Launching application. -
@Littlejohn21 said in MMM-forecast-io -- Localized up to the minute weather:
Please correct syntax errors.
It could be something as simple as a comma, or quote being out of place, or missing.
Post your config here for help, but please follow this guide on how to post code on the forum correctly.
https://forum.magicmirror.builders/topic/4247/how-to-post-code-on-the-forum-for-absolute-beginners
-
modules: [
		{
			module: "alert",
		},
		{
			module: "updatenotification",
			position: "top_bar"
		},
		{
			module: "clock",
			position: "top_left"
		},
		{
			module: "calendar",
			header: "US Holidays",
			position: "top_left",
			config: {
				calendars: [
					{
						symbol: "calendar-check-o ",
						url: "webcal://www.calendarlabs.com/templates/ical/US-Holidays.ics"
					}
				]
			}
		},
		{
			module: "compliments",
			position: "lower_third"
		},
		{
			module: 'MMM-forecast-io',
    			position: 'top_right',  // This can be any of the regions.
  		        config: {
    			// See 'Configuration options' for more information.
     		        apiKey: '6xxxxxxxxxxxxxxxxxxxxxxxxxxxx3', // Dark Sky API key.
      			// Only required if geolocation doesn't work:
       			latitude:   29.853357,
      			longitude: -81.389680
			}
		},
		{
			module: "newsfeed",
			position: "bottom_bar",
			config: {
				feeds: [
					{
						title: "New York Times",
						url: "http://www.nytimes.com/services/xml/rss/nyt/HomePage.xml"
					}
				],
				showSourceTitle: true,
				showPublishDate: true
			}
		},
	]

};
I have tried several ways and have even ran the npm run config:check it says thet expected to see { but sees something else.
Hello! It looks like you're interested in this conversation, but you don't have an account yet.
Getting fed up of having to scroll through the same posts each visit? When you register for an account, you'll always come back to exactly where you were before, and choose to be notified of new replies (either via email, or push notification). You'll also be able to save bookmarks and upvote posts to show your appreciation to other community members.
With your input, this post could be even better 💗
Register Login