Read the statement by Michael Teeuw here.
MMM-AVStock v2.0.0 (npm update required!)
-
Small update on new API.
I am working on including IEX Cloud API. Have been successful for quotes.
However the API has a limit for their free tier (as they all have) and requesting historic prices comsumes a LOT of usage quota.
For the charts to show we need this historical data however.
I am considering using both sources for the different purposes (i.e. IEX for quotes and AV for historic data).
So users would need 2 API keys for the complete module or one if they don’t want to see the chart.
If anyone has a better idea and knowledge about the API, let me know!Have a great weekend everyone!
-
@lavolp3 said in MMM-AVStock v2.0.0 (npm update required!):
nd
Do you think you will work on fixing the API? or letting it go since it’s now behind a payall. Loved it while it lasted regardless!
-
@cml For anyone looking for a fix, found on github via user “SleipnirMS”
"When using chartInterval = daily, you have to set it to “daily_adjusted” and replace both “daily” entries in node_helper.js to “daily_adjusted”.
Then it uses the free api part and everything is fine again."
-
MMM-AVStock has been REANIMATED!
I have pushed a branch that uses the yahoo finance API and leaves Alphavantage behind for good.
Config should work as before, so anyone who wants to test, please let me know how it works!
You don’t need any new API Key! -
@lavolp3 New branch works great! Thanks for updating this!
-
Thanks!
I still need to work on the ticker and update the readme. Hope I can get this done in the next weeks. -
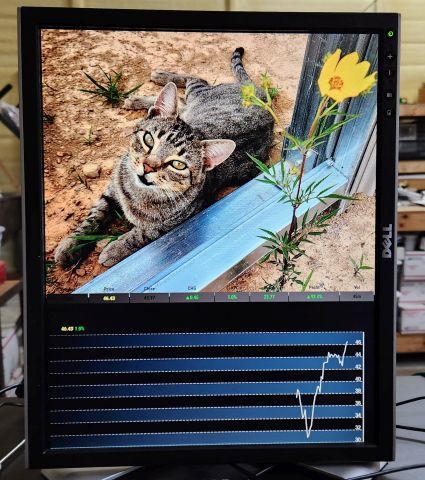
I’m looking for a little help to make my chart look better. I’m only interested in one stock so that is all I am displaying. I notice the docs say the chart is only 90 days but the examples show 4 or 5 months. Anyway to increase past 90 days? OR, is there anyway to get the chart to stretch the 90 days out so it takes up the width of my vertical monitor? Anyway to get the months listed at the bottom of the chart? Any suggestions on how to make the chart look better? Thanks!
FWIW, I had a hard time getting this to run. The solution for me was to get version 18 of node running (someone else mentioned this). I was too dumb to do this until I found this webpage: https://pimylifeup.com/raspberry-pi-nodejs/
Also, mode : “chart”, did not work for me (showed a blank page).
-
Anyone??? I’ll bump this to see if anyone can help. There has to be a way to get the chart to look better than this.