Read the statement by Michael Teeuw here.
[MMM-ApexCharts] ApexCharts.js for your mirror.
-
Description:
Chart module using ApexCharts.js for MagicMirror².
I’m aware of the other chart modules out there, but I like using ApexCharts.js in my projects. Coloring via themes and its monochrome option make it a perfect match for a mirror project.
Chart data can be supplied in config or pulled from JSON api.
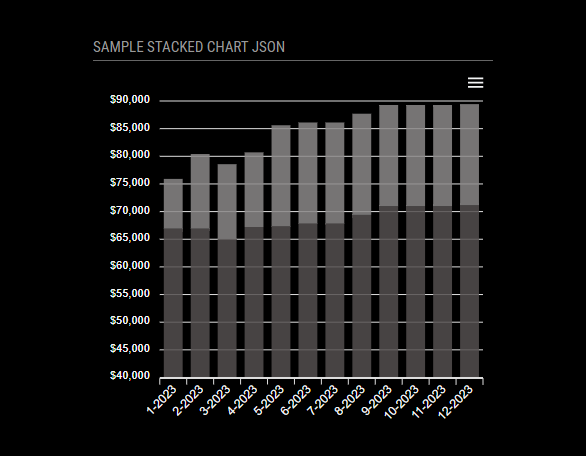
Screenshots:
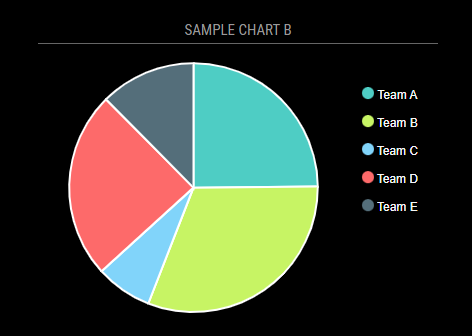
Pie chart with default options
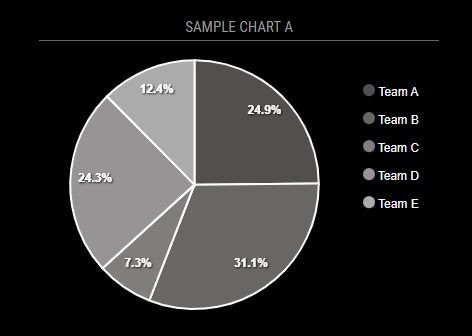
Same pie chart with custom options:
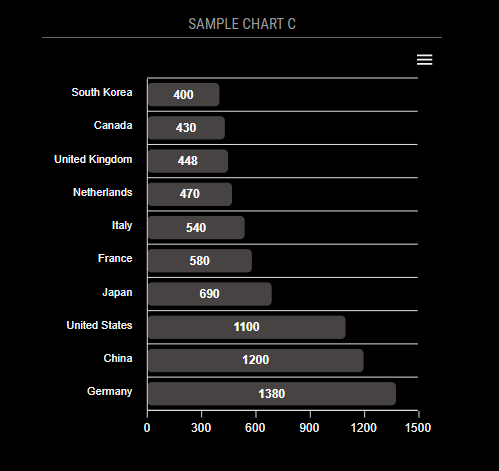
Bar chart with default options:
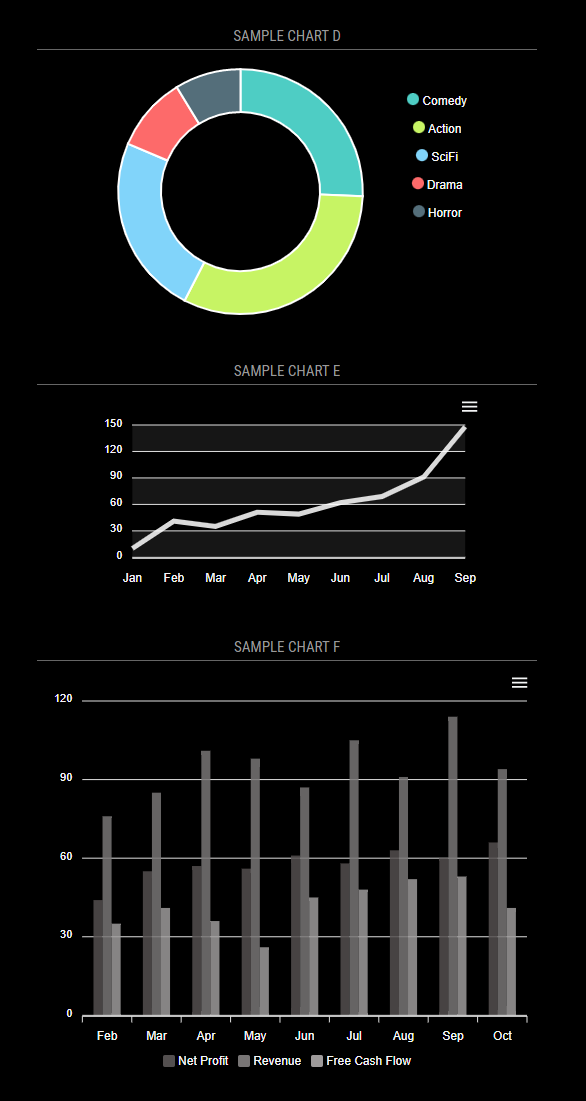
Allows for multiple charts:
Download / Instructions:
https://github.com/sharmstr/MMM-ApexCharts
Version 1
Initial release
Version 2
JSON fetch data interval added
Version 2.1
Support for stacked bar charts added
Samples added to github wiki
Added json api endpoint with sample data for testing. -
JSON fetch interval added via chartInterval option. If option is not specified in config, the chart will only load JSON data at startup.
-
V2.1:
-
Added support for stacked charts.
-
Added a json api endpoint with sample data you can use for testing
http://my-json-server.typicode.com/sharmstr/MMM-ApexCharts
-
-
Realy nice 👏 Thank you!
-
hi @sharmstr your module looks great and I was just trying it out.
Would you be able to provide a sample config.js entry for it (e.g. for showing one of your example charts)?
I’ve installed the module and had a go at updating my config.js following the instructions at https://github.com/sharmstr/MMM-ApexCharts, and given it a URL to your test data, hoping to show a bar chart to get started with.
I’m unsure how to add the chartConfig options though and don’t think I have the format correct.
The mirror currently starts but doesn’t show a chart, and the Console shows several errors like Uncaught (in promise) TypeError: Cannot read properties of undefined (reading ‘forEach’)
hopefully I’ve just forgotten something stupid/obvious!
My config.js entry for the module so far looks like
{
  			module: 'MMM-ApexCharts',
  			position: "middle_center",
			config: {
	    			chartBackground: "transparent",
	    			chartDataLabels: false,
	    			chartJsonFormat: "paired",
	    			chartJsonInterval: "",
	    			chartJsonUrl: "http://my-json-server.typicode.com/sharmstr/MMM-ApexCharts/paired",
	    			chartMonochrome: true,
	    			chartMonochromeColor: "#534F4F",
	    			chartThemeMode: "dark",
	    			chartThemePalette: "palette1",
	    			chartWidth: 400,
	    			chartConfig: {
	    					chart: {
						    type: 'bar'
  							},
						}
				}
		},
thanks for any assistance in the meantime : )
-
There are several working examples in the wiki
-
@sharmstr said in [MMM-ApexCharts] ApexCharts.js for your mirror.:
There are several working examples in the wiki
Hi - thankyou very much - and apologies for somehow not finding your great documentation! I’ve been able to get sample charts working now.
Just some notes on where I’ve got to with my mirror - I’ve been trying MMM-ApexCharts out using a mini power monitor called an IotaWatt as a datasource. It sits on my home network and collects power readings from my mains connection using a current transformer. You can then query this data back and possibly use it to draw graphs.
Queries are just done with an http request and look like:
http://MyIotaWatt.local/query?select=[time.local,InstPower_W.wh.d2]&begin=s-24h&end=s&group=1h&format=json&header=noreturning (in this case) json with readings for total power usage (kWatt hours) for each of the previous 24 hours.
Responses look like (e.g.)0 0 "2024-09-21T14:05:00" 1 0.76 1 0 "2024-09-21T13:05:00" 1 0.75 2 0 "2024-09-21T12:05:00" 1 0.73 etcso this has worked well with the paired chartJsonFormat config.
Things I found useful so far:
- if I put the http://iotawatt.local/query?… in the chartJsonUrl config then the log showed that the call failed with a CORS error. I’ve got it to return data if I add the local CORS server prefix though i.e.
http://localhost:8080/cors?url=http://MyIotaWatt.local/query?...- Times returned in the response match NZ local time, but the labels on my chart’s x-axis originally displayed times 12 hours earlier. I’ve included a datetimeUTC entry in my
xaxis.labelsconfig to leave it in local time
xaxis: { type: "datetime", tickPlacement: "off", labels: { datetimeUTC: false, format: "HH:mm", } },@sharmstr I’ve also been trying out showing more than one chart on the mirror, following your sample config. Is there a way to show two charts when both make their own call to a datasource (i.e. with separate chartJsonUrls?)
This would be useful in my case to show a chart for Detailed power usage (over last 30 mins) and a separate chart for Overview (usage in last 24 hours).I’ve configured these charts to work individually, but when I add both to my config at the same time (with different chartIDs) the 2nd chart doesn’t show on the mirror. The log shows json responses to both calls, but also an error
Uncaught (in promise) TypeError: Cannot read properties of null (reading '1')
following the 2nd response. Is there a neat way to allow both charts, or have I just messed it up? Thanks very much
Hello! It looks like you're interested in this conversation, but you don't have an account yet.
Getting fed up of having to scroll through the same posts each visit? When you register for an account, you'll always come back to exactly where you were before, and choose to be notified of new replies (either via email, or push notification). You'll also be able to save bookmarks and upvote posts to show your appreciation to other community members.
With your input, this post could be even better 💗
Register Login