Read the statement by Michael Teeuw here.
MMM-COVID-19 (Deprecated)
-
NOTICE FOR NOT SUPPORTING ANYMORE
- When I created this module, there was no COVID-19 related modules, so I made it by myself. This module consumes data from the FIRST original root source from Johns Hopkins University Center for Systems Science and Engineering (JHU CCSE) But JHU CCSE changes its data format too often and without notice, so this module is not stable. (I’m very disappointed about JHU CCSS data management)
And at this moment, there are at least two working COVID-19 related modules in MagicMirror. So I’ll quit supporting this module. Use alternatives.
Sorry, and thank you for things.
MMM-COVID-19
MM module for current COVID-19 virus status.
Credits
This data is derived from Johns Hopkins University Center for Systems Science and Engineering (JHU CCSE)
Original data is located here
Screenshot
[card:eouia/MMM-COVID-19]
-
@Sean Thanks! I’ve created a sort of Coronavirus dashboard on my MagicMirror by utilizing the following modules:
- MMM-COVID-19
- MMM-News
- newsfeed
- MMM-iFrame
- MMM-pages
Using these configuration entries:
{ module: "MMM-News", position: "top_center", config: { apiKey : "xxxxxxxxxxxx", type: "vertical", touchable: false, telegramBotOrderOpenDetail : true, query : [ { sources: "abc-news, bbc-news, cnn, google-news", }, { country: "us", category: "health", q : "coronavirus" }, { country: "uk", category: "health", q : "coronavirus" } ], } }, { module: "MMM-COVID-19", header: "Coronavirus Daily Update", position: "bottom_bar", config: { scanInterval: 1000 * 60 * 60 * 12, rotateInterval: 1000 * 5, detailProvince: true, // pinned: ["Mainland China", null], // pinned: ["Others", "Diamond Princess cruise ship"], // pinned: ["US", "Santa Clara, CA"], pinned: ["US"], logProvinceCountry: false, logOnce: true, sortOrder: null, } }, { module: "newsfeed", position: "bottom_bar", config: { feeds: [ { title: "Centers for Disease Control", url: "https://tools.cdc.gov/api/v2/resources/media/403372.rss" }, { title: "Johns Hopkins Medicine", url: "https://www.hopkinsmedicine.org/news/media/releases/?format=rss" }, { title: "World Health Organization", url: "https://www.who.int/feeds/entity/csr/don/en/rss.xml" }, ], showSourceTitle: true, showPublishDate: true, broadcastNewsFeeds: true, broadcastNewsUpdates: true } }, { module: 'MMM-iFrame', position: 'fullscreen_below', config: { url: [ "https://gisanddata.maps.arcgis.com/apps/opsdashboard/index.html#/bda7594740fd40299423467b48e9ecf6", "https://www.arcgis.com/apps/opsdashboard/index.html#/85320e2ea5424dfaaa75ae62e5c06e61", "https://windy.app/coronavirus_map", "https://experience.arcgis.com/experience/685d0ace521648f8a5beeeee1b9125cd", ], updateInterval: 3 * 60 * 1000, // rotate URLs every 3 minutes width: "1080", // width of iframe height: "1920", // height of iframe frameWidth: "1080" } }, { module: 'MMM-pages', config: { modules: [[ "MMM-News", "newsfeed", "MMM-COVID-19"], [ "MMM-iFrame"]], fixed: ["alert", "updatenotification", "MMM-Remote-Control", "MMM-TelegramBot"], rotationTime: 900000, // rotate page every 15 minutes = 15 * 60 * 1000 } }, ... -
@Sean I like it very much but my wife would kill me if I put this on the bathroom mirror! Would need a face recognition for that.
What I would find interesting are the daily cases of “new confirmed” vs “new recovered”. You think that would be able to be implemented? -
@lavolp3
In API, timeseries data could be derived also. So I think possible. Maybe I can add a line-graph for last 10 days with canvas too. But frankly says, I wish someone make it for me. Always I’m making modules by myself because nobody makes it for me before. Myself is very lazy. :)
Today, I have a prior work to finish, so in 2~3 days I’ll add that feature new confirmed and new recovered. -
@Sean Can you give me a source for the time_series data?
Then I’ll try to add a graph via chart.js and send a PR -
@lavolp3
You can use https://github.com/Laeyoung/COVID-19-API
Or you can find several apis by googling -
@Sean I’ve tried to call the timeseries link with the implemented XMLHTTPrequest but only get an incomplete answer (readyState 3, Status 200)
Any suggestions? -
@lavolp3
I’ll try and implement your requested feature in 1~2 days. Thanks for interesting. :) -
@Sean working on it and not too far from finished in this branch
https://github.com/lavolp3/MMM-COVID-19/tree/timeseriesSource data is called and parsed to an array which can be used by the chart. This part is done
The chart however is not yet shown in the dom. Chart.js is always tricky for me since the dom object needs to be created first and then filled with the chart.
Also the many dom updates due the revolving regions does not help for me.But I guess it’s a start.
-
@lavolp3
I’m removing a dependency of API, Instead, data will be accessed from Original JohnsHopkins GitHub directly. So, can you wait a while till refactoring is finished? (1~2 days will be taken) -
@lavolp3 said in MMM-COVID-19:
Chart.js is always tricky for me since the dom object needs to be created first and then filled with the chart.
It shouldn’t be that hard.
If the div doesn’t exist, create it
If u have data /new data to display, create the chart into that div, else leave it empty.Update chart didn’t work for me very well. So I delete the prior when building the new chart.
-
@sdetweil you’re right. It gets more difficult if I do it in a rep I haven’t created. Need to find out the workflow first and sometimes crate workarounds. Every MM module developer has their own ways of creating update/call cycles.
However since I’m really new to JS this is all still quite challenging. -
@lavolp3 i don’t think JS is the problem, its a pretty simple language…
I think the MM runtime, and module structure is a challenge…
u can look at my repo using chartjs here…
https://github.com/sdetweil/WaterLevels
i had two sets of data from my server and wanted two charts…
so they are an array of chart info… -
New Updates
2.0.0(2020-03-04)- Whole new build. (
npm installis needed to update) - Removed: depedency of external API. Data is derived from original source directly.
- Removed: some overspec config options.
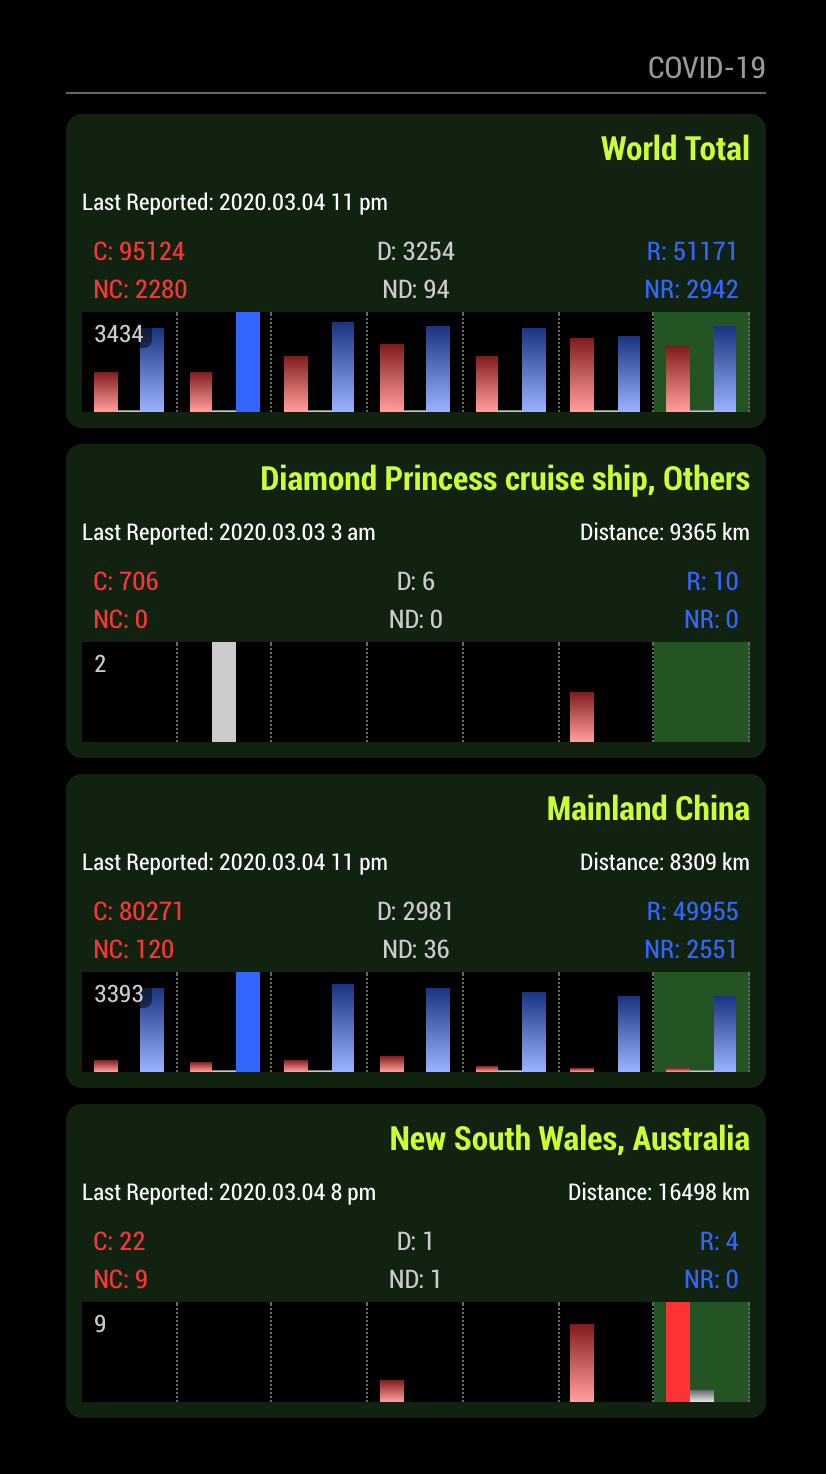
- Added: past 7-days bar graph.
- Added: new confirmed, new deaths, new recovered of 1 day before (… of update date)
- Added : info section, last reported time, distance from me.
- Changed : multi pinned. pin key format changed.
- Chagned : more controllable by CSS.
Screenshot
- Whole new build. (
-
@Sean Looks veeeery good! Nice work! I can scrap my fork now :-)
-
-
@Sean :face_with_tears_of_joy:
No, that’s not enough.
I keep this on my development dashboard -
The World Total doesn’t show numbers anymore, but instead it just comes back with ‘NaN’. How can we fix this?
-
@x5nder
I’ll see. -
@x5nder
There was some invalid data schemes in original source. I fixed urgently now. (But I’ll inspect deeper tomorrow)

Hello! It looks like you're interested in this conversation, but you don't have an account yet.
Getting fed up of having to scroll through the same posts each visit? When you register for an account, you'll always come back to exactly where you were before, and choose to be notified of new replies (either via email, or push notification). You'll also be able to save bookmarks and upvote posts to show your appreciation to other community members.
With your input, this post could be even better 💗
Register Login