Read the statement by Michael Teeuw here.
covid bell curve line graph tracker
-
new update, data source changed … after git pull, need to run npm install again to update the library used to read the data (csv instead of xlsx)
-
@sdetweil can you drop an example of the config for two graphs displayed at once?
Edit: nevermind, I was overthinking it.
-
grrr… data source not yet updated today… waiting, sent them a note…
I switched to the csv file (available earlier)…
now xlsx is right, csv, json and xml files not updated… and in the xlsx, they changed the column headings…
-
@sdetweil after sending email, they have updated the csv file now…
also, uploaded new version with lots of text formatting control, see the now long readme
also added ability to change the start date for the chart, see startDate in the readme -
now supports states charts too
git pull,
in config states:[] vs countries:[]

-
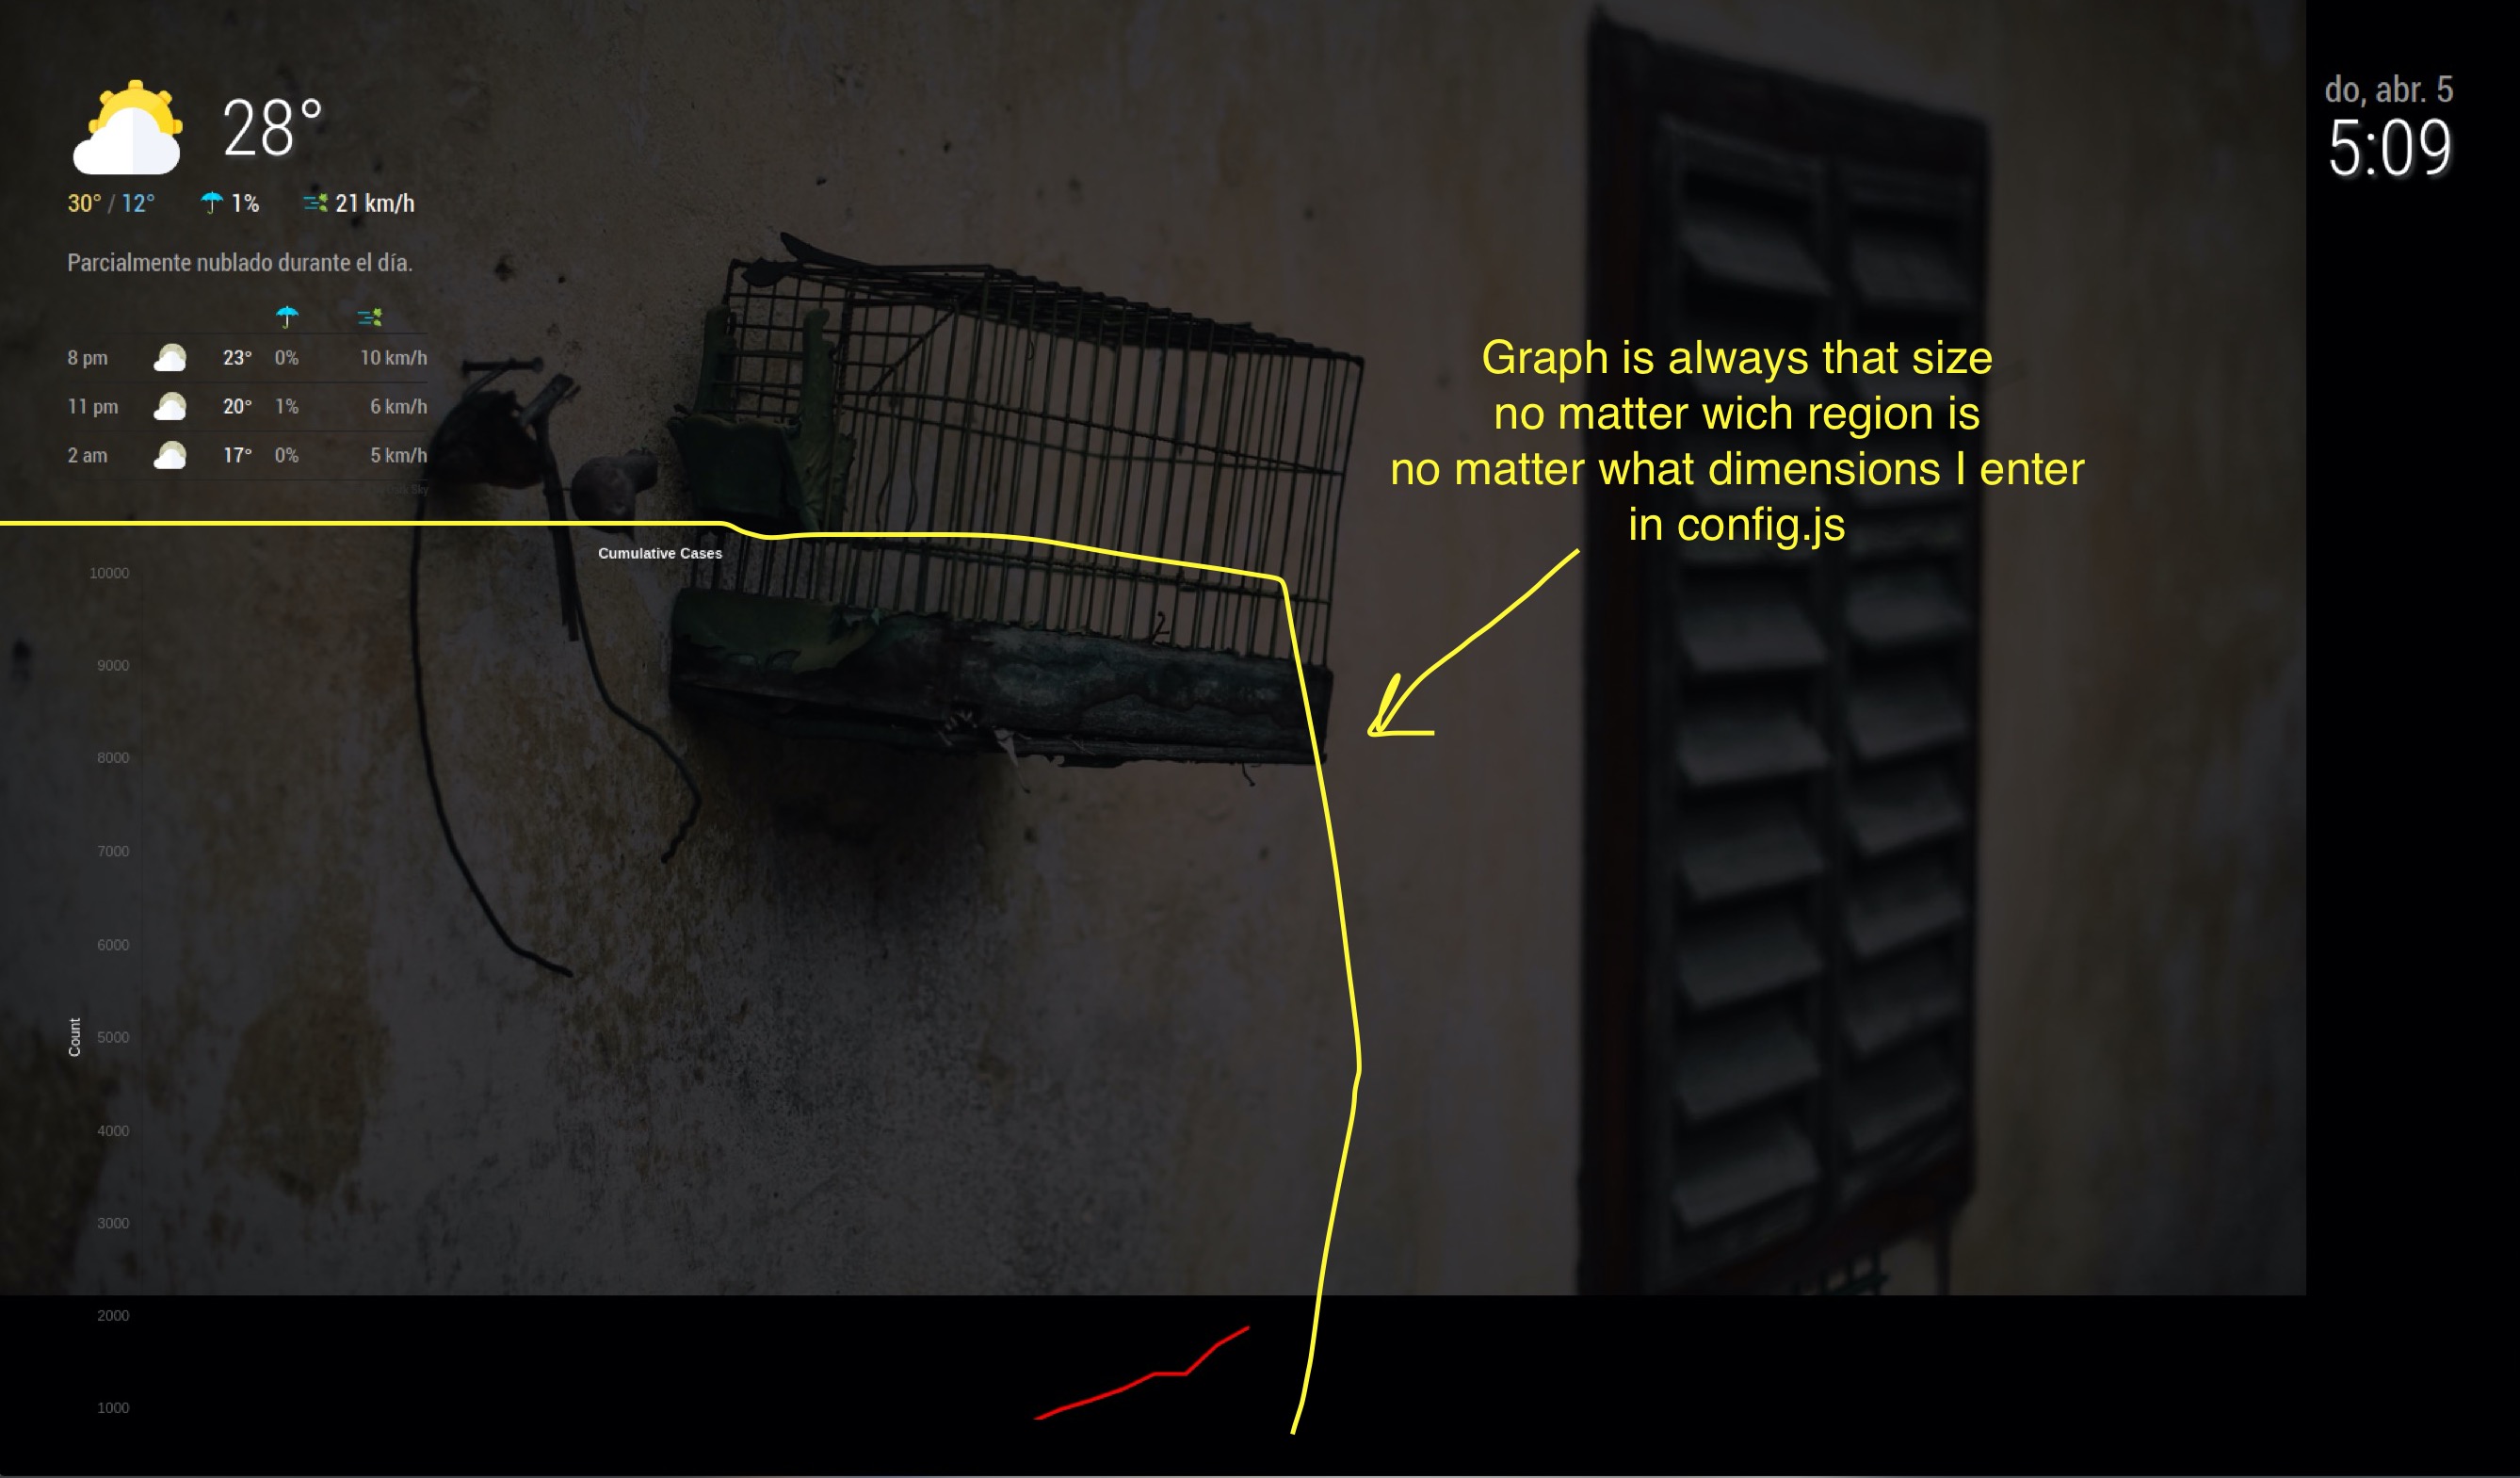
Looks great! I’m looking forward in using this module, but I just don’t get the chart dimensions to work, the size is always the same, big, and it doesn’t matter which region I use.
This is my config
            {
                            disabled: false,
                            module:"MyCovid19",
                            position:"top_left",
                            config:{
                                    countries:["Mexico"],
                                    line_colors:['red','white','green','yellow','blue'],
                                    chart_type:"cumulative_cases",
                                    chart_title:"Cumulative Cases",
                                    ranges:{min:0,max:10000,stepSize:1000},
                                    startDate: "03/01/2020",
                                    backgroundColor: "transparent",
                                    width: 300,
                                    height: 500,
                                    debug:false,
                            },
            },
And this is the result, I’ll try to attach a screen capture, let’s see if I can!
-
@rafaelcota hm… I usually have this
		{
			module:"MyCovid19",
			disabled:false,
			position:"top_left",
			config:{
				states:["Michigan", 'Texas','Illinois', 'Florida','California','Louisiana','Washington','New York',],
				// line colors can be any definition of color either a name ,or a hex string
				// one per country above, used in order,
				line_colors:['red','white','green','yellow','#34ebde','#34eb00','purple','orange'],
				//
				chart_type:"deaths",  // or "cumulative deaths"
				chart_title:"daily new deaths by state", // however u want to label
				// the vertical steps on the chart.. how tall u want it to be and how mant increments
				ranges:{min:0,max:000,stepSize:10},
				// size of the chart in pixels
			    width: 400,
			    height: 800,
			    // only used if we need to debug something
			    //debug:true,
			    startDate:'03/10/2020',
			    debug:true,
			//    startLabel:['2/1/2020','3/1/2020']
			    //backgroundColor: 'white',
			}
		}
400x 400 (w x h)

but changed to 400 x 800 (w x h)

-
I added the calendar and changed to 300 x 800

-
@sdetweil I know, that’s how it supposed to work, but not in my mirror… It’s driving me crazy… I’ve tried almost everything…
-
@rafaelcota when was the last time you did a git pull?
I just used your definition and changed height to 800 and it came out right… (wrong image before)

-
@sdetweil I’ve just downloaded today, just a few minutes before I tried.
This is what I’m seeing right now with the following config (tried with states now):
            {
                            disabled: false,
                            module:"MyCovid19",
                            position:"top_center",
                            config:{
                                    states:['Kentucky','Colorado','Arizona'],
                                    line_colors:['red','white','green','yellow','blue'],
                                    chart_type:"cumulative_cases",  // or "cumulative deaths"
                                    chart_title:"Cumulative Cases", // however u want to label
                                    ranges:{min:0,max:8000,stepSize:10000},
                                    width: 200,
                                    height: 300,
                                    debug: true,
                            },
            },
-
I don’t use any special classes
var c = document.createElement("div"); // < container for chart c.style.width = self.config.width + "px"; c.style.height = self.config.height + "px"; self.wrapper.appendChild(c); canvas = document.createElement("canvas"); // < --- chart itself canvas.id = "myChart" +self.ourID ; canvas.style.width = (self.config.width -10) + "px"; canvas.style.height = self.config.height + "px"; canvas.style.backgroundColor=self.config.backgroundColor; c.appendChild(canvas); -
@rafaelcota i don’t see it, but maybe there is a weird character between width and 400
so, take the space out, for both height and width
width:400,
height:800,
how big is your screen?
-
@rafaelcota great work!!..
for grins, edits the MyCovid19.js
line 168ish
          if (!self.config.stacked)
            c.style.display = 'inline-block';
comment out those two lines…
the prior module which I cloned had the ability to generate multiple charts at once,
but how that got set in your instance I have no idea… -
@sdetweil
This is what I’ve done so far:I’ve deleted the spaces in height and width and numbers;
I’ve disabled ALL other modules, so this one runs alone;
I’ve commented out those two lines in MyCovid19.jsAnd all still the same…
It just gets the dimensions from wherever it gets them… so weird…
-
@rafaelcota but now it shouldn’t have inline-block applied, in the elements view
-
@rafaelcota BTW, my resolution is 1920 x 1080 in an RPI 4
-
@rafaelcota and I am running this particular test on a 1920x1080 ubuntu… but my pi4 is just behind me at 3840x2160
-
@sdetweil
It still there…
I’m sure you have better things to do than debug this with a user… I’m going to do a clean install, even if it does mean to use the brand new MM version (don’t have much installed, and have lots of time nowadays) and see what happens… -
@rafaelcota use my installer script
see here
https://github.com/sdetweil/MagicMirror_scripts
Hello! It looks like you're interested in this conversation, but you don't have an account yet.
Getting fed up of having to scroll through the same posts each visit? When you register for an account, you'll always come back to exactly where you were before, and choose to be notified of new replies (either via email, or push notification). You'll also be able to save bookmarks and upvote posts to show your appreciation to other community members.
With your input, this post could be even better 💗
Register Login