Read the statement by Michael Teeuw here.
Debugging
-
Hi all,
I’m trying to develop a new module to contribute to the community.
My question is, I’m trying to develop this thing, and apart from blindly running the npm and seeing the results, I don’t have much in a method of debugging. Does anyone have a technique here to debug whilst running?
Also, my function requires a height and width to be set; But I’m not seeing anything in any of the other examples where a height and width is set.
-
For debugging purposes, I sprinkle
'Log.log("...")'statements in my code which I can then see in the console log. For example, in mycalendar_monthlymodule, I have a'debugging'flag that I can set which then outputs this bit in the console log:= = = = = = = = = = = = = = = = = = = = = = = = = = = = = = CALENDAR_MONTHLY IS IN DEBUG MODE! Remove 'debugging' option from config/config.js to disable. Current moment(): 1466399977889 (11:19:37 pm) scheduleUpdate() delay set at: 1466402400000 nextReload should happen at: 1466402400000 (12:00:00 am) which is in: 40 minutes and 22 seconds. midnight set at: 1466402400000 (12:00:00 am) = = = = = = = = = = = = = = = = = = = = = = = = = = = = = =That output helped a great deal when I needed to accurately calculate those values (and I couldn’t figure out why the delay I was setting wasn’t right.)
Having log notifications like that helps. I tend to put them in places where I need to check for a value, or verify that a condition is being met, before the rest of the code continues on. It’s worth nothing that I load the running mirror remotely on my development desktop machine (through Chrome or Firefox) by going to my rpi’s IP and MM’s port. I don’t touch the actual running task on the rpi itself, once loaded, I leave it alone. When I make a change in the code, I can refresh my browser and see the results immediately without affecting the mirror itself. It’s not till I’m certain the code works that I will restart the npm process on the mirror. This has the added advantage that I can see the current running code on the mirror and compare it with what the new/changed code shows on my remote browser.
As for the height/width part, those are being set in the main CSS file. Because it’s a fluid layout, there is no exact numbers, it’s all calculated at run-time based on the monitor’s resolution. So you’ll have to use the main layout “box” for the position that your module will be in, and then work within that. Setting fixed sizes will cause problems later down the road with folks who don’t have the same resolution as you.
-
That makes sense. So then I guess I have 2 questions leading on from that:
-
I’m attempting to create a dynamic 3d model but I need a height and width. Is there any way to retrieve the rendered height and width at runtime based on the resolution?
-
Using a browser to go to the rip’s IP via the MM port sounds useful. How do I retrieve the rip’s IP/MM port?
thanks again for the response
-
-
- Nope, or unknown rather.
- Check your router for the IP of the devices connected to it, or on the rpi, type
ifconfigat the prompt. If you’re connected wirelessly, look for thewlan0block. If it’s hard wired, look for theeth0block.
And if you have access to your router, it’s worth setting the rpi’s IP to always be the same.
-
Darn. That makes things a little more difficult.
Any advice on how to approach that then? Since I have a dynamic 3D object that needs a rendering size to construct.
I can keep it at a static size, allow config files to set it?.. Small, medium and large I guess?
-
This might help you: http://www.w3schools.com/jsref/prop_element_offsetwidth.asp
-
Or if you wish to run your module with jQuery, using .width() and .height() will also give you the size of the element.
-
Thanks for your response. I’m still working on it (and something else for another member) - I’m still having trouble accessing/finding a log. For the most part, right now, I’m running the npm from my computer directly and using the electron app there.
I’m not able to find any log file, or any tool that allows me to debug in real-time. Because of the nature of this app and the modules, it becomes a little more complex than just following instructions that I’ve seen/Any advice?
-
I guess I’m not sure what you mean with ‘real-time debugging’ as there is no real-time anything between the node server and the browser. Everything runs on the browser end, and because of that, you can open the console window and watch what’s happening, in as ‘real-time’ as possible. I’m also not sure what exactly you are trying to debug.
As I explained before, when I’m writing code, I watch the console log for errors. I simply refresh the browser when I need to check for things. Remember, I don’t use the actual Raspberry Pi nor the monitor connected to it to debug. I load up the mirror on a regular browser on my computer and debug there. I also write code there.
Hrm, it dawned on me that I should explain better how I’m doing this …
-
Even when writing console.log(’ ') nothing appears in the terminal, so I just assumed it was logging elsewhere.
How are you accessing it via your browser?
-
Nothing would appear in the terminal, it’s not the STDOUT facility that you’re using. The console.log() facility logs to the browser’s console log. With most browsers, you access this by pressing F12. This is what my desktop looks like when I’m coding. Note that this is a Windows machine with dual monitors. On the left monitor is my code editor, split into two panels so I can look at multiple files at the same time. The files are being opened directly from the MagicMirror folder on the Raspberry Pi. On the right is a Chrome browser open with the Raspberry Pi’s IP address. That loads up the mirror display. And by hitting F12, I get the console panel that you see open, and at the bottom you can see the debugging messages that I put in the code to track. I can write/change code in the editor, hit Save, then hit Refresh in Chrome and get instant feedback. All of that is completely independent of what’s actually being displayed on the Raspberri Pi’s monitor.
The panel also allows me to see the actual HTML being returned (by selecting
Elementsat the top.) So any code that I write, I can verify the HTML bit, and I can follow along with any errors or other messages that I put in the code. When the mirror code fails for some reason, I can look in the console and try to figure out where the error lies.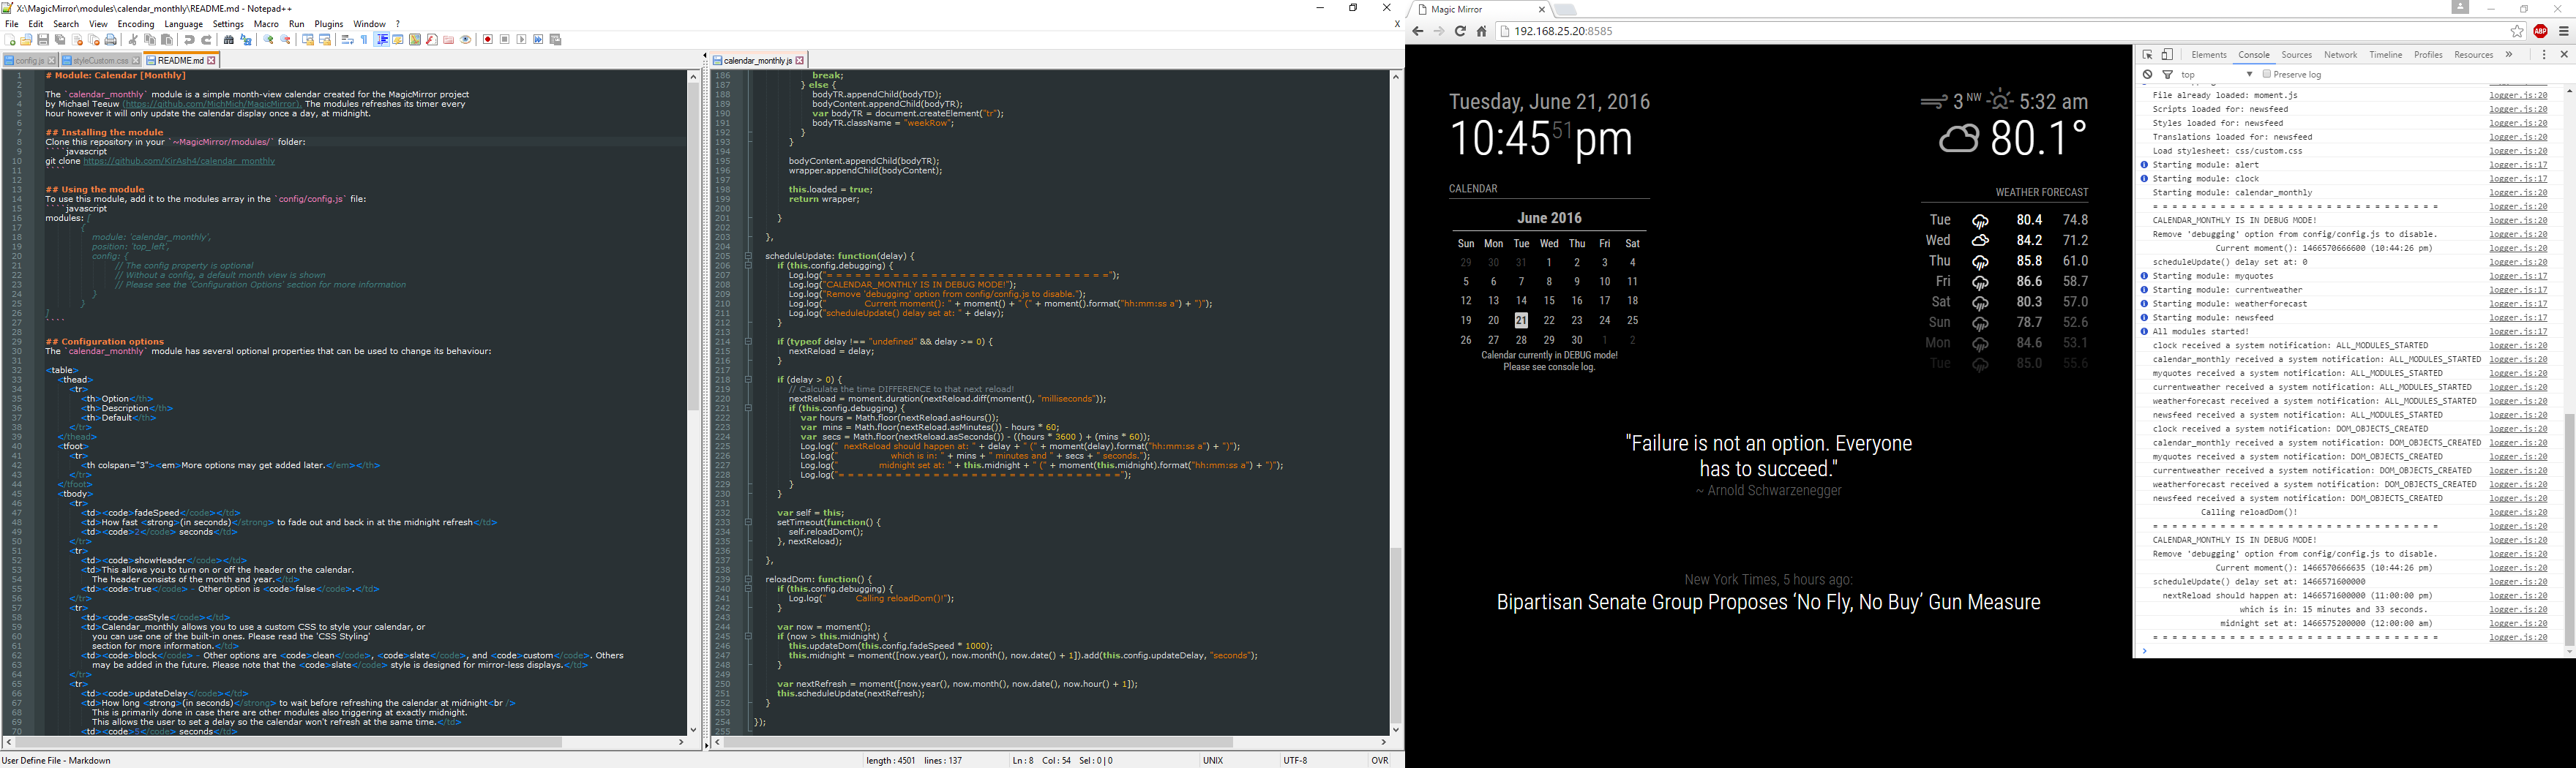
-
Your last post helped immensely! Thank you!
-
Sorry to keep on this. Is there a particular way I’m able to look at a particular object’s available functions in console (if there is a way, I can’t see it and google is turning up zilch)
-
I suspect the answer is: go read the source code … but, what are you trying to do?
-
It’s my source code :laughing: - My object should have an available function to me, but it’s coming up function not found. I’m gonna keep digging! New module is on its way.
-
Theeeeen you’re not defining it as a function … ?
-
You don’t have to run the the code in the electron every time. I would just run “node index” from the /serveronly folder and start the chrome with dev tools on my dev box. Also as dev tool Visual Studio Code is a very good one and runs on Windows, Linux and OS X. You could configure it to debug the node.js as well as the chrome client (via a plugin) locally or even have a remote debugging session.
-
This post is deleted! -
I could not use
Log.log('foobar');in the node_helper.js and if i useconsole.log('foobar');the log is shown in the CLI. Is there a solution to show it in the Browser Console? -
@BenRoe quote from the readme
The Magic Mirror contains a convenience wrapper for logging. Currently, this logger is a simple proxy to the original console.log methods. But it might get additional features in the future. The Loggers is currently only available in the core module file (not in the node_helper).so everything you have experinced is as it should beinstead of logging in the node_helper directly you could send the string, objects, etc. to your module and use the logger there to view it in the browsers console
Hello! It looks like you're interested in this conversation, but you don't have an account yet.
Getting fed up of having to scroll through the same posts each visit? When you register for an account, you'll always come back to exactly where you were before, and choose to be notified of new replies (either via email, or push notification). You'll also be able to save bookmarks and upvote posts to show your appreciation to other community members.
With your input, this post could be even better 💗
Register Login