Ok, new try! I got caught up with some other stuff and started a new topic since it’s been more than half a year since my last attempt at publishing my module… My first attempt at publishing on github was unsuccessful (see previous discussion) so I decided to move the whole repository to Codeberg. Perhaps this works better :-)
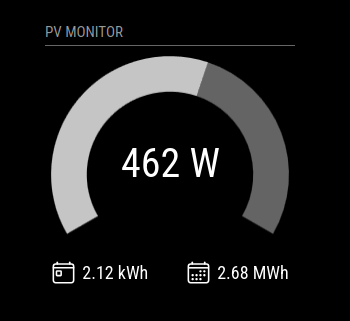
A MagicMirror² module that displays live PV power and energy data from a Hoymiles DTU using a Chart.js donut chart.
This module queries the DTU via the local network at regular intervals and visualizes the current power, daily energy, and total energy values on your MagicMirror.