Read the statement by Michael Teeuw here.
MMM-Chart - View your graphs on your Mirror
-
Description:
This Module adds graphs to your MagicMirror 2.1 using your JSON source(s) from a URL.
It’s built upon the chartjs “ecosystem”.I’m currently using small PHP scripts to pull information from my own “house-database” and then let PHP create the JSON string form the data. :) You have to provide your own “data-source” of course. :)
There are A LOT of configuration options in this module. I will update the README on git later on. But if you want to know more, just read the MMM-Chart.js. I have tried to document it fairly well.
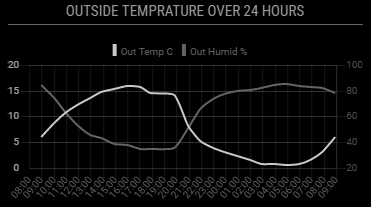
The source can be either a table of values for like this (updating the whole graph on every update):
[["2017-04-21 15:58:00",8.3,95.5],["2017-04-21 14:55:00",9.3,90.5],["2017-04-21 12:56:00",10.7,87.7],["2017-04-21 11:53:00",10.5,87.7],["2017-04-21 11:01:00",10.6,88.8]]...That will give something like this:
Screenshot:
Or you can use a “real time” source looking something like this (adding values to the graph on every update):[["2017-04-21 15:58:00",48.3,95.5,31]]Screenshot:
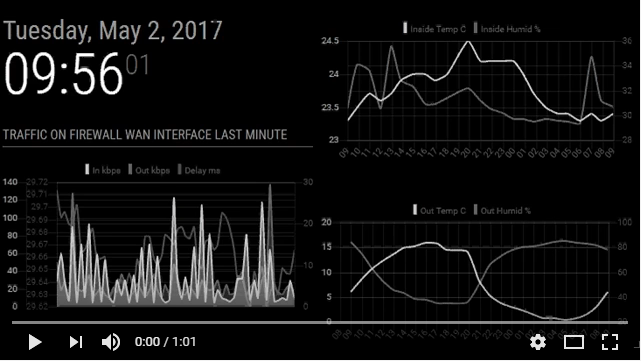
Both together looks like this (video):
Download:
[card:Snille/MMM-Chart]
Version 1.0
- Initial release.
This is a work in progress…
OBS: I have not yet tested this module on my RPI!!
Please come with feedback/PR:s Let me know how it works.The idea was triggered from the “dynchart module” by Chris van Marl. Thank you!
-
That looks really good. I log my sense hat readings to a file on my pi. Would it be possible to use your module to read that data?
-
@d3r Hi! Thank you. Not directly, but if you build a script (maybe in node or in PHP) that parse the file and present the data in the form of JSON, it is possible.
-
Hi all! I finally tried out the Chart module on a RPi3 (Jessie Lite install) with the latest MM2. But I can’t get the graphs to show. Is there anyone out there using my module who have it working?
The charts work fine in Chrome or Firefox on another machine… That’s how I developed the module. :) -
Hello!
I’m using dht22 modul wich is working fine, and tough will give a try with this module. I used this how-to ( http://www.instructables.com/id/Raspberry-PI-and-DHT22-temperature-and-humidity-lo/ ) to log the temps, and this php script to generate the json: ( http://www.kodingmadesimple.com/2015/01/convert-mysql-to-json-using-php.html )php //open connection to mysql db $connection = mysqli_connect("localhost","logger","password","temperatures") or die("Error " . mysqli_error($connection)); //fetch table rows from mysql db $sql = "select * from temperaturedata"; $result = mysqli_query($connection, $sql) or die("Error in Selecting " . mysqli_error($connection)); //create an array $emparray = array(); while($row =mysqli_fetch_assoc($result)) { $emparray[] = $row['dateandtime']; $emparray[] = $row['temperature']; $emparray[] = $row['humidity']; } echo json_encode($emparray); //close the db connection mysqli_close($connection); ?>This give me this result:
[“2017-07-06 11:37:59”,“26.3”,“46.9”,“2017-07-06 11:45:02”,“26.3”,“46.1”,“2017-07-06 11:50:01”,“26.4”,“45.7”,… and so on ]I set the correct url in the config, but I cant get it to work :( Maybe the result is not right?
-
and the whole “set” also needs to be inside [ ] as well. :)Here is some of my config… This is one of my graphs.
{
	module: 'MMM-Chart',
	position: 'top_center',
	header: 'Temp & Fukt Ute senaste 24 timmarna',
	config: {
		name: "outside",
		url: "http://10.0.0.20/housedata/housedata.php?id=9,10&max=24&sort=desc",
		graphStyle: "line",
		xaxisLabelTicks: true,
		updateInterval: 600000,
		graphFill0: true,
		graphLabel0: "Temp ute C",
		graphLineColor0: "rgba(200, 200, 200, 1)",
		graphTickColor0: "rgba(200, 200, 200, 1)",
		graphFillColor0: "rgba(200, 200, 200, 0.2)",
		graphFill1: true,
		graphLabel1: "Fukt ute %",
		graphLineColor1: "rgba(100, 100, 155, 1)",
		graphTickColor1: "rgba(100, 100, 155, 1)",
		graphFillColor1: "rgba(100, 100, 155, 0.2)",
		xaxisTimeUnit: "hour",
		xaxisTimeFormatLabels: "HH",
	}
},
And the JSON looks like this:
[["2017-07-07 08:56:00",16.9,85],["2017-07-07 06:58:00",13.4,91.3],["2017-07-07 05:54:00",13.3,90.4],["2017-07-07 05:02:00",13.4,89.2],["2017-07-07 03:58:00",13.6,88.2],["2017-07-07 02:55:00",13.6,90],["2017-07-07 01:50:00",13.5,91.9],["2017-07-07 00:57:00",13.6,92.6],["2017-07-06 23:54:00",13.6,90],["2017-07-06 20:55:00",20.1,67.9],["2017-07-06 19:50:00",27.1,52.3],["2017-07-06 18:57:00",25.5,55.1],["2017-07-06 17:54:00",22.4,58.1],["2017-07-06 17:02:00",22.6,66.3],["2017-07-06 15:59:00",22.1,64.4],["2017-07-06 14:56:00",22,65.7],["2017-07-06 13:49:00",21.1,66],["2017-07-06 12:57:00",19.8,66.9],["2017-07-06 11:54:00",18.7,67.1],["2017-07-06 11:01:00",17.6,75.8],["2017-07-06 09:59:00",16.5,79.7],["2017-07-06 07:50:00",12,95.5],["2017-07-06 06:58:00",10.6,98.2],["2017-07-06 05:54:00",9.4,97.7]]I think the missing fist (and last) “[” “]” may be the problem. :)
-
@Snille :) thanks! How do I add them? Can you send me the php script you are using? It will be a big help for me ! Thx
-
Hi, this is a part of my php pickup/conversion script…
I hope this can help you. :)// Get all the data from the database. foreach ($ids as $i => $idnum) { //Fetches the data from MYSQL via PDO. $values[] = getvalues($dbservername, $dbname, $dbusername, $dbpassword, $deftable, $defsensoridcolumn, $max, $ids[$i], $sort); } // Initialize the array. $outarray = array(); $first = 0; foreach ($values as $key => $value) { $position = 0; foreach ($values[$key] as $i => $value) { If ($first == 0) { $outarray[$position][] = $values[$key][$i]["time"]; } $outarray[$position][] = floatval($values[$key][$i]["value"]); $position++; } $first++; } // Make it JSON. $json = json_encode($outarray); // Print it. echo $json; -
@Snille Thanks! Will try this ! I will let you know the results :)
-
Finally it’s working :) Thanks for the help. I use googlespread sheet, csv export, and php to convert it to json. If some somebody interested I can give some help.
-
Hy it was quite hard to get the dht22 values showing up with your chart.
finally i got the php script working to fetch mysql data to your json format:
//your code here //open connection to mysql db $connection = mysqli_connect("localhost","logger","password","temperatures") or die("Err$ //fetch table rows from mysql db $sql = "select * from temperaturedata"; $result = mysqli_query($connection, $sql) or die("Error in Selecting " . mysqli_erro$ //create an array $emparray = array(); $position=0; while($row =mysqli_fetch_assoc($result)) { $emparray[$position][] = $row['dateandtime']; $emparray[$position][] = $row['temperature']; $emparray[$position][] = $row['humidity']; $position++; } echo json_encode($emparray); //close the db connection mysqli_close($connection); -
Hy i also have troubles with the real time chart.
it shows the chart only for 0,5s and then it will disapear?
do you ever had this issue?
and is it possible to ad more ticks on the x-axis?
if i display temp data from a day, it will only show two ticks -
Good day all,
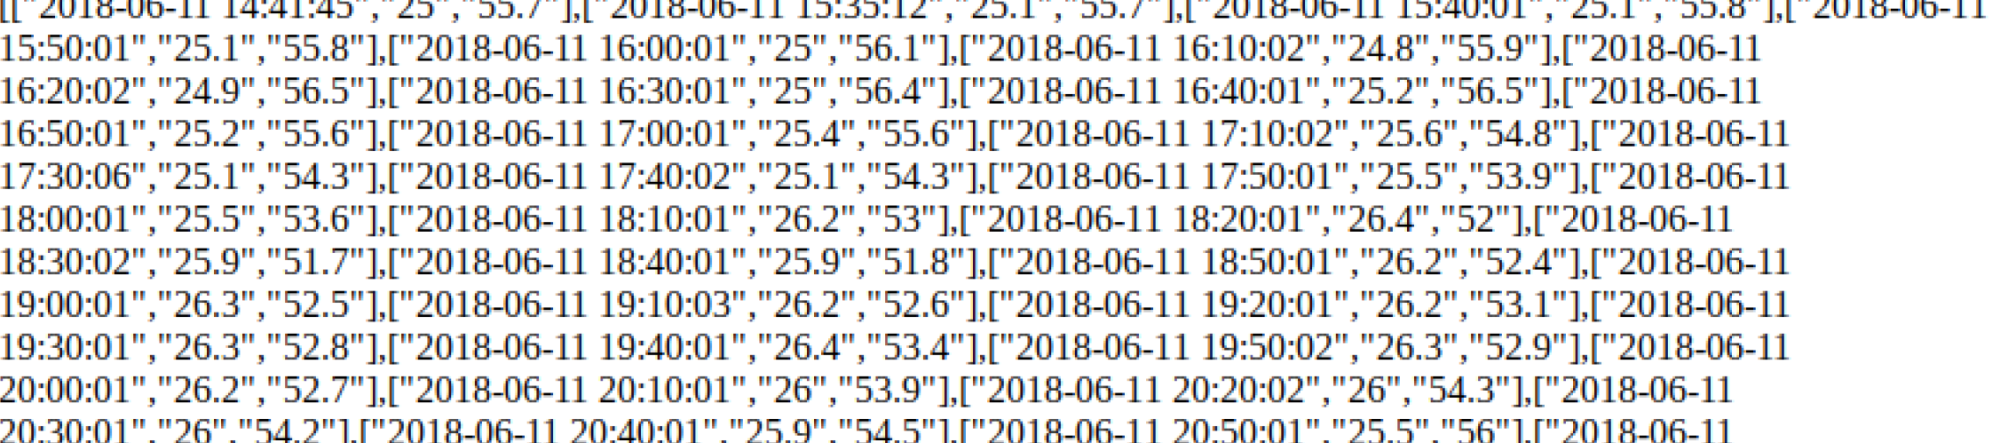
i’m able to see my data locally on my php file, but unfortunately i cannot see the graph on my MM page…This is what i see when i open my index.php file:
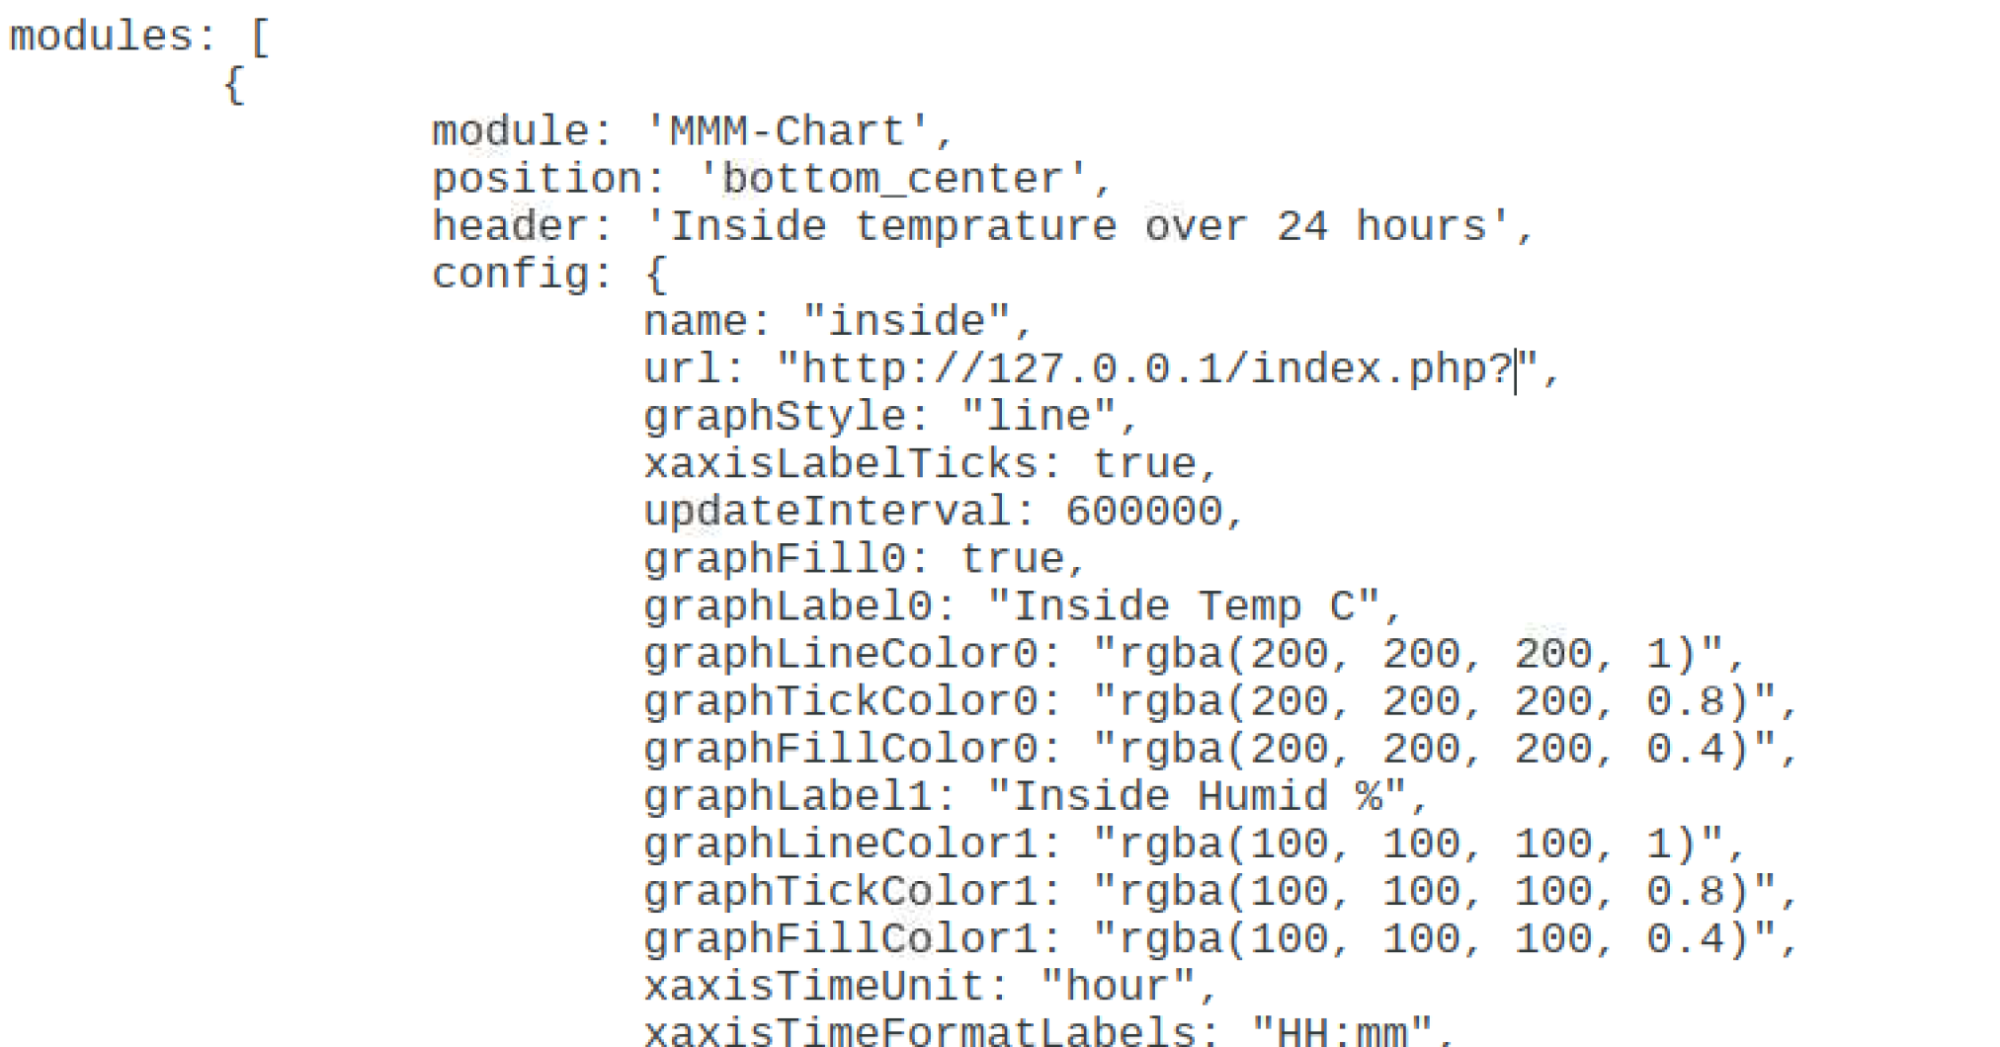
This is the config file:
And this is what i see in my MM page:

Any suggestion? Consider that i’m not an expert…
Thanks.
Regards.
-
(
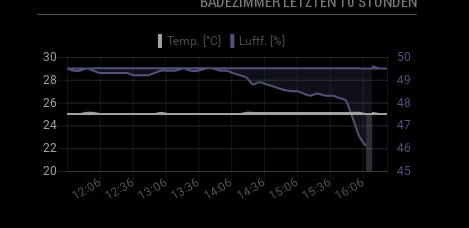 image url)
I have the issue that the graph is jumping back to the beginning.
Has anyone else this issue?
@zazzo hm strange your data looks code…
-
Hy i solved the issue with jumping values.
you are deleting the y axis values in the file mmm-chart.js
but not the label dataarray.
i added the line:
this.chartData.labels = [];
at #296 and now i have fixed the jumping value issuei also added the suggestedMin/Max parameter and to change the line chart to a stepped line chart
-
@logen563 Hi. I am interested how you did this? Would like to display graph. Data is from an xml file that I download daily.
-
@ricq you have to convert the xml to the json format.
i have now build a python script which provides the data from my sensors.
or you build a php script…
-
This post is deleted! -
How do i turn my MQTT temperature data from Mosquito into jason data providing me with a url for this module? or is there a way to get your module to read an mqtt topic?
-
@zazzo how did you create that php file in the first place? I’m new to this and really struggling. thanks in advance
Hello! It looks like you're interested in this conversation, but you don't have an account yet.
Getting fed up of having to scroll through the same posts each visit? When you register for an account, you'll always come back to exactly where you were before, and choose to be notified of new replies (either via email, or push notification). You'll also be able to save bookmarks and upvote posts to show your appreciation to other community members.
With your input, this post could be even better 💗
Register Login