Yes, that’d be the easiest option. Could be running tonigt. ;)
Personally, I’d go with the json, though. I did it like this with Highcharts.js, which seems familiar to MMM-Charts:
node-helper.js:
const fs = require("fs");
//...
    socketNotificationReceived: function(notification, payload) {
        if (notification === "UpdateChart") {
        	this.getChart();
        }
    },
    getChart: function() {

		var rawdata = fs.readFileSync('path/to/my.json');
		var history = JSON.parse(rawdata);
		var history = history.slice(-84); // 12 per day x 7 = I only want the last 84 data points
		this.sendSocketNotification("ChartUpdate", history);
	}
module.js:
getScripts: function() {
return [
this.file("highcharts/highcharts.js"),
this.file("highcharts/series-label.js"),
this.file("highcharts/exporting.js")
]
},
socketNotificationReceived: function(notification, payload) {
if (notification === "ChartUpdate") {
this.getChart(payload);
}
},
getChart: function(history) {
var chart = "";
for(i = 0; i < history.length; i++) {
if (i === 0) {
chart = history[i].litre;
}
else {
chart = chart + ", " + history[i].price;
}
}
var maxi = Math.max.apply(Math, JSON.parse("[" + chart + "]"));
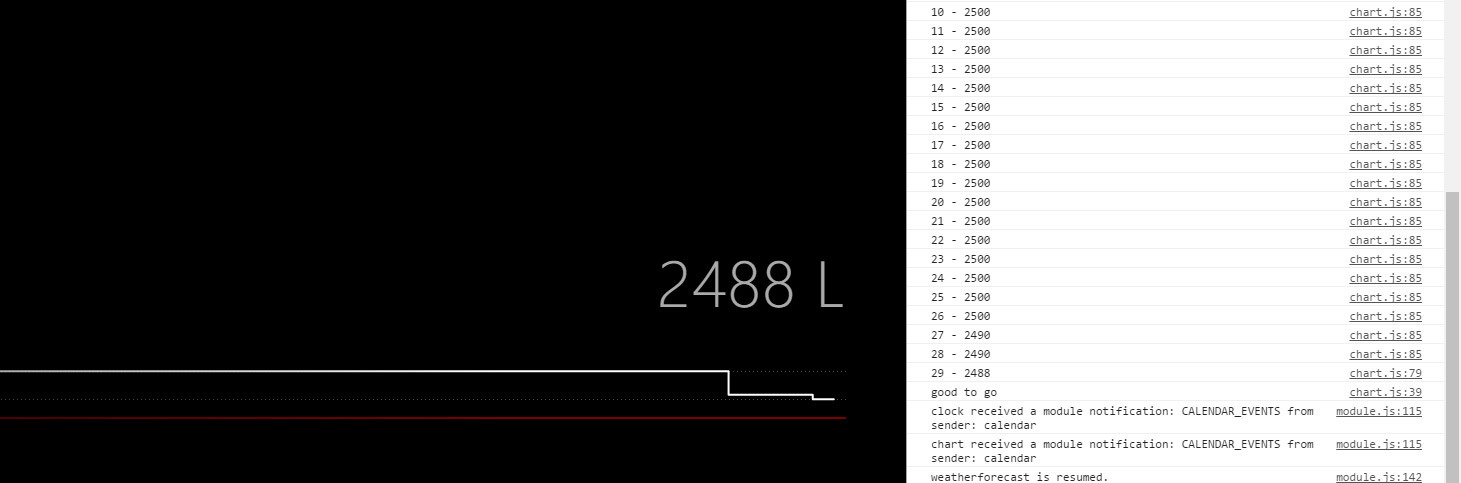
var highest = maxi.toString() + " L";
var mini = Math.min.apply(Math, JSON.parse("[" + chart + "]"));
var lowest = mini.toString() + " L";
Highcharts.chart('module-chart', { // the id of the div to contain the chart!
chart: {
height: 175,
margin: 0,
left: 0
},
plotOptions: {
series: {
marker: {
enabled: false
}
}
},
tooltip: {
pointFormat: "Value: {point.y:.2f}"
},
yAxis: {
min: mini-0.05,
max: maxi+0.05,
tickInterval: 0.05,
plotLines: [{
value: this.price,
dashStyle: 'solid',
width: 1,
color: {
linearGradient: [0, 0, 900, 0],
stops: [
[0, 'rgba(255, 255, 255, 0.1)'],
[1, 'rgba(255, 255, 255, 0.2)']
]
}
}, {
value: Math.max.apply(Math, JSON.parse("[" + pricelist + "]")),
dashStyle: 'dot',
width: 1,
color: {
linearGradient: [0, 0, 900, 0],
stops: [
[0, 'rgba(255, 255, 255, 0.2)'],
[1, 'rgba(255, 255, 255, 0.3)']
]
},
label: {
text: highest,
x: -2,
y: -7
}
},
{
value: Math.min.apply(Math, JSON.parse("[" + pricelist + "]")),
dashStyle: 'dot',
width: 1,
color: {
linearGradient: [0, 0, 900, 0],
stops: [
[0, 'rgba(255, 255, 255, 0.2)'],
[1, 'rgba(255, 255, 255, 0.3)']
]
},
label: {
text: lowest,
x: -2,
y: 13
}
}]
},
series: [{
data: JSON.parse("[" + pricelist + "]"), // here's the action
step: 'center',
lineWidth: 2,
color: {
linearGradient: [0, 0, 900, 0],
stops: [
[0, 'rgba(255, 255, 255, 0.4)'],
[1, 'rgba(255, 255, 255, 1)']
]
}
}]
});
}