Read the statement by Michael Teeuw here.
MMM-GrafanaCharts and MMM-GrafanaGauges: Display you data with Charts and Gauges. Beautifully.
-
@planet4 Hey, I just tried it with the actual Grafana v6.0.1 (commit: 0c44a04)
It worked for me without any adjustments.Maybe I can support you, to set it up.
-
@SvenSommer Thanks for replying. I was actually able to solve it but with version 6 of Grafana black background is more of a trouble. Wrote a short post about this as well.
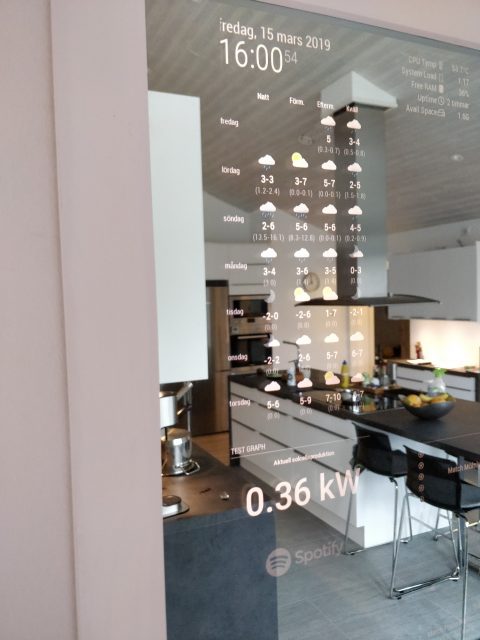
http://www.planet4.se/grafana-in-magic-mirror/
I am now able to show my Solar production on my mirror. 0,36kW. Will post this in the show my mirror as well. Thanks.
-
@planet4 thanks
your post helped me half way
im using home assistant to host grafana so i needed to create an org called home assistant. -
@teitlebot I am using Home Assistant as well but Grafana is not used as an add-in on Hassio. I have it on a separate docker container. However I gave up Grafana in the end. It was to much problems. Now I use MQTT to get all information I want from Home Assistant to my Mirror. Like this:
-
@planet4 What other problems did grafana give you? I am also using the mmm hass component to pull in sensor date but maybe I will switch to mmm mqtt. I really wanted to show some nice graph though. Also how did you build the total solar energy sensor saving in hass? I build it in graphana following someones tutorial,
-
edit reposted to be in same thread…
Hi,
Have been using this module for a couple of years now without any problems. Yesterday I upgraded my Grafana server and discovered they had implemented a security change where you had to allow_embedded=true. After doing this change I was back on track again, except that I can only see my GrafanaGauges when I point my browser to my MagicMirror IP, it does not show up on the MM screen itself. I see it takes it places and all modules around aligns perfectly around it, but the content onscreen is blank/black. Have been troubleshooting everything from both Grafana side and MagicMirror side. It will not show up on the screen only when I point my browser to the MM, then I see the screen with all content as it should…
Now I am clueless… Not sure if this is module-specific or content from Grafana that does it. My next step to try som iFrame modules to show the same content…
Any ideas?Regards
-
edit
Case closed.
With no errors what so ever from the MM side, everything seemed to work normal. Either MM or the modules I tried did not resolve FQDN names… ! (MM is configured with two local DNS servers) I think this should be reported in some of the logs on MM… Nothing.
I figured it out when I did a lsof on my Grafana server and there were no connection from the MM there… Only my own pc… LOLWell, back in business again after some hours troubleshooting… Probably learnt a thing or two also along the way.
I tried with another module capable of showing iframes. Same problem there. It refuses to show the content on the MM monitor only on a browser from another computer. There everythings shows up as normal.
Even removed all other modules sharing the same position as this one.I am stuck…
-
Hello, thanks for your module!
I would use the bar graph? Both vertical and horizontal?
it’s possible ? If not, do I want to add this function? Thanks so much again for the module! -
Does anyone know if anything happened to dev? I haven’t seen anything from him on the internet since 2018.
Is this project dead?
-
@iorifly
The project seems to be dead :( -
Hello everyone,
I would like to set up a system that takes the data from the temperature/humidity sensors, the values recorded in a database and with Grafana graphing the values and then displaying everything on MM.
What other methods/modules are available to graph this information on MM?
From what I understand @SvenSommer modules don’t work anymore …Thanks
-
@Egnos You can use RDDTOOL, I described it here: https://forum.magicmirror.builders/topic/16575/cpu-temperature-as-a-graph-with-rrdtool?_=1666781012238
But instead of creating an extra html, you can use the output directly with MMM-EasyPix://################################################################################# { disabled: false, module: "MMM-EasyPix", position: "top_center", config: { picName: "cputemp.gif", maxWidth: "100%", // sounds: ["1.mp3", "me2.mp3"], updateInterval: 600000, animationSpeed: 1000, } }, //################################################################################# -
@planet4 Hi - I have seen your temperature module, it looks nice, I am not a developer, Would you be kind enough to share your Temperature module with me…the one with the gauge - Thank you.
Hello! It looks like you're interested in this conversation, but you don't have an account yet.
Getting fed up of having to scroll through the same posts each visit? When you register for an account, you'll always come back to exactly where you were before, and choose to be notified of new replies (either via email, or push notification). You'll also be able to save bookmarks and upvote posts to show your appreciation to other community members.
With your input, this post could be even better 💗
Register Login