Read the statement by Michael Teeuw here.
has anyone used any of the charting tools, like chartjs?
-
I have updated the code now to improve performance…
- reduce number of data points, by decimation (using 1 point of every 5) to get to 800 points. See info once every 5th minutes, vs once a minute
- build 800 point data from in memory CSV (api sends back csv data) by looking from NOW (end) til previous (backwards) which reduces the number of lines of data processed from 14000 to 4000 (configurable number of days for chart)
- create a color gradient table start-end: color, start-end:color2… to draw multiple colors on chart, as part of the data selection in 1 and 2 above… this make the processor O(1) (single pass), instead of O(4)
performance is much improved…
prior, 4000 points, elapsed time for 2 charts, 39 seconds. now 3.5 seconds (odroid). pi crashed with 4000 points at 4 minutes elapsed… now just about 4.5 seconds -
I have no idea what you just said but I upvoted your post anyway. :-)
-
no i never use charting tool what is the function of that tool???
-
@tarun well… basically to create charts from data …
-
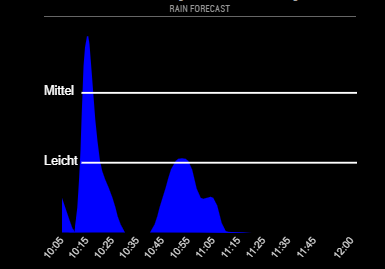
I have now used chartjs as well on the MMM-rain-forecast module by @cirdan and SpoturDeal.

I like it and there are some plugins to use as well.
First results can be achieved very quickly, but if you want to change further specific things, it’s getting difficult with the various objects.@sdetweil do you know of a complete set of options for chartjs? I find the documentation a bit too short and confusing.
-
@lavolp3 i do not… there are tons of options, which I guess you would expect.
