Read the statement by Michael Teeuw here.
MMM-Tibber
-
Show electricity price data from Tibber.
Tibber customers can see the price per hour for today and tomorrow.

See https://github.com/ottopaulsen/MMM-Tibber for more.
-
Hi @ottopaulsen
Love that you have created this one! I´m also using tibber at home, and my token works on my Hass.io, but I cannot make it run on my MM. Only error I can see is “No Tibber data”. Got any tips on how to dig into what I have done wrong with my code? I just copied your suggestion for setup and added my access token from Tibber.
-
@TheGizmo said in MMM-Tibber:
Hi @ottopaulsen
Love that you have created this one! I´m also using tibber at home, and my token works on my Hass.io, but I cannot make it run on my MM. Only error I can see is “No Tibber data”. Got any tips on how to dig into what I have done wrong with my code? I just copied your suggestion for setup and added my access token from Tibber.
From the error logs:
ATTENTION: default value of option force_s3tc_enable overridden by environment.
ReferenceError: log is not defined
at Class.readTibberPrices (/home/pi/MagicMirror/modules/MMM-Tibber/node_helper.js:34:9)
at Class.socketNotificationReceived (/home/pi/MagicMirror/modules/MMM-Tibber/node_helper.js:26:18)
at Socket. (/home/pi/MagicMirror/modules/node_modules/node_helper/index.js:113:11)
at Socket.emit (events.js:182:13)
at /home/pi/MagicMirror/node_modules/socket.io/lib/socket.js:528:12
at process._tickCallback (internal/process/next_tick.js:61:11) -
@TheGizmo said in MMM-Tibber:
at Class.readTibberPrices (/home/pi/MagicMirror/modules/MMM-Tibber/node_helper.js:34:9)
looks like the node helper has a typo…
edit line 34
change from
log("readTibberPrices")to this
this.log("readTibberPrices")line 44 is correct
-
@sdetweil Thx for looking into this, changed and still the same.
Error from log:
Error getting tibber prices: TypeError: Cannot read property ‘viewer’ of null
at rp.then.res (/home/pi/MagicMirror/modules/MMM-Tibber/tibber.js:51:35)
at tryCatcher (/home/pi/MagicMirror/modules/MMM-Tibber/node_modules/bluebird/js/release/util.js:16:23)
at Promise._settlePromiseFromHandler (/home/pi/MagicMirror/modules/MMM-Tibber/node_modules/bluebird/js/release/promise.js:547:31)
at Promise._settlePromise (/home/pi/MagicMirror/modules/MMM-Tibber/node_modules/bluebird/js/release/promise.js:604:18)
at Promise._settlePromise0 (/home/pi/MagicMirror/modules/MMM-Tibber/node_modules/bluebird/js/release/promise.js:649:10)
at Promise._settlePromises (/home/pi/MagicMirror/modules/MMM-Tibber/node_modules/bluebird/js/release/promise.js:729:18)
at _drainQueueStep (/home/pi/MagicMirror/modules/MMM-Tibber/node_modules/bluebird/js/release/async.js:93:12)
at _drainQueue (/home/pi/MagicMirror/modules/MMM-Tibber/node_modules/bluebird/js/release/async.js:86:9)
at Async._drainQueues (/home/pi/MagicMirror/modules/MMM-Tibber/node_modules/bluebird/js/release/async.js:102:5)
at Immediate.Async.drainQueues [as _onImmediate] (/home/pi/MagicMirror/modules/MMM-Tibber/node_modules/bluebird/js/release/async.js:15:14)
at runCallback (timers.js:696:18)
at tryOnImmediate (timers.js:667:5)
at processImmediate (timers.js:649:5) -
Really cool! Makes me want to switch to Tibber myself.
One idea… doesn’t Tibber provide your real time consumption as well? Couldn’t that be included?
-
@ottopaulsen Looks impressive. I see that you’re using highcharts for the chart. Is that free to use?
I only see “buy” buttons on their page. -
@retroflex yes they do, if you have their puls addon. I do, and it works in Home Assistant. I started to look into how I can use one addon to read from HA (not a developer, more visionary guy)
-
@TheGizmo said in MMM-Tibber:
at processImmediate (timers.js:649:5)
no… now the api is returning and error that the code is not handling…
-
I have digged more into this, and I cannot see that the module asks Tibber for data at all, (Using Pi-Hole at home) and there are no requests towards Tibber domain.
-
@TheGizmo supposedly it called for something at this url
const gqlEndpoint = “https://api.tibber.com/v1-beta/gql”
and thinks it got a good response as it is parsing the data
 .then(res => {
                resO = JSON.parse(res.body);
                resolve(resO.data.viewer.homes[0].currentSubscription.priceInfo) < --- this line fails
the api IS called beta , “v1-beta”, so maybe they changed the response
you could add a line to dump out the returned data
.then(res => { resO = JSON.parse(res.body); console.log("tibber response="+ resO); // < --- add this line resolve(resO.data.viewer.homes[0].currentSubscription.priceInfo) -
So, I woke up today, and guess what.
I have Tibber data. It have pulled some data during the night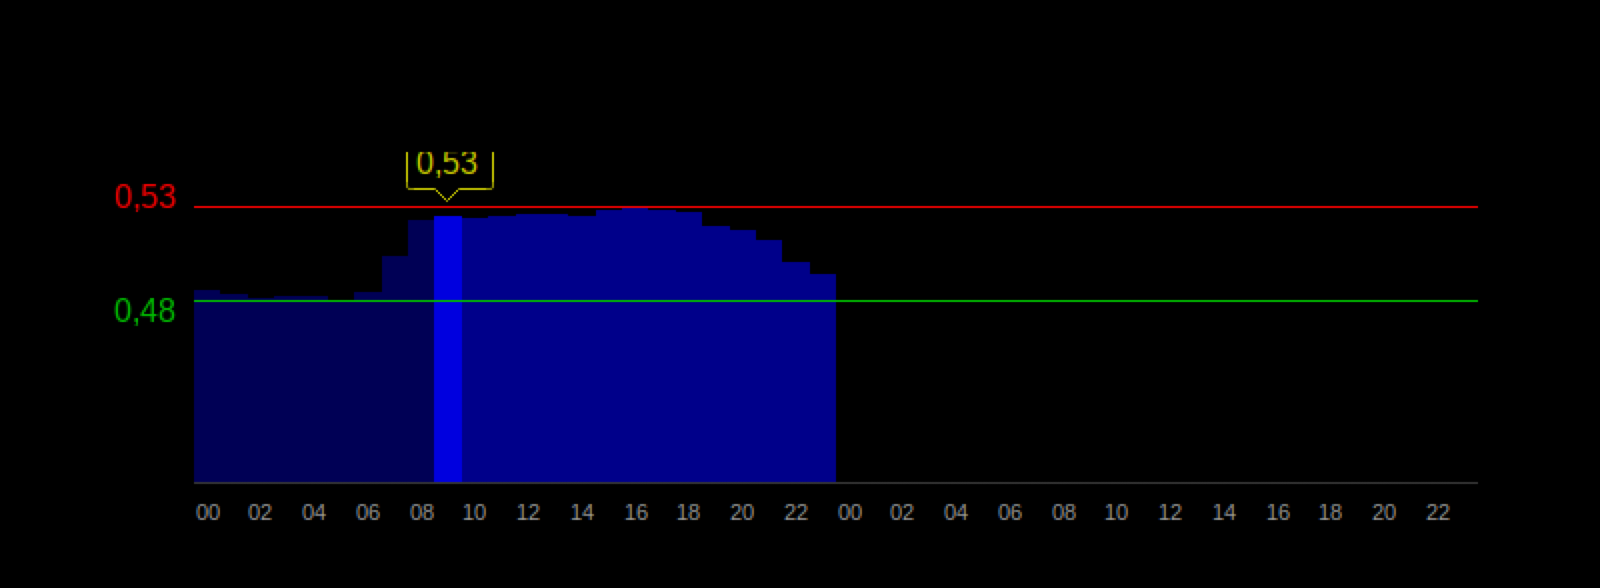
-
@TheGizmo cool, and weird!..
-
Hi all.
I haven’t gotten any notifications from this forum, so I was not aware of the conversation until today, when @kennethnilssen mentioned it on github. Sorry about that.
I believe the issue with the this.log() statement in node_helper.js is solved and fixed in the latest version on Github.
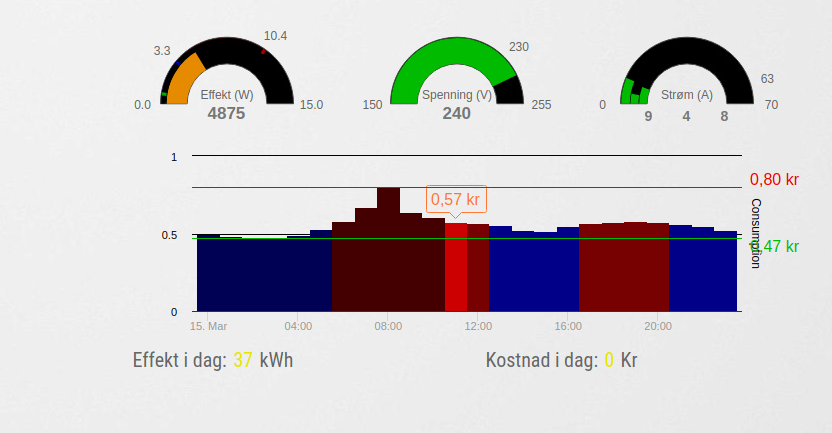
I just received my Tibber Pulse, so I am currently working on showing consumption, and will also look in to real time consumption (as asked by @retroflex), so I am currently doing a major upgrade.
To @lavolp3 's question about Highcharts, yes, as I understand their license terms, it is free to use for non-commercial purposes, like this obviously is.
If you have bug reports or change suggestions, I prefer them as github issues.
Cool to see so many people using this :-) It is inspiring!
-
Hi folks, I just updated the MMM-Tibber module, so now it also shows consumption, if you have Tibber Pulse installed. Please help testing, and report bugs on Github.
-
Just tested and it works great!
If I could come with a request, it would be not to show the graphs but only the data. So that I could only see the current consumption or by hours and the current pricing.
-
Thanks for a fantastic module!
Its working great, except the consumption curve in the graph.
The only config line I have for the module is the “tibbertoken”.
Do I need to add the consumption curve config, or should it be enabled as default?
Hello! It looks like you're interested in this conversation, but you don't have an account yet.
Getting fed up of having to scroll through the same posts each visit? When you register for an account, you'll always come back to exactly where you were before, and choose to be notified of new replies (either via email, or push notification). You'll also be able to save bookmarks and upvote posts to show your appreciation to other community members.
With your input, this post could be even better 💗
Register Login