Read the statement by Michael Teeuw here.
MMM-Domoticz-ext: interact with Domoticz
-
@goedh452
I started from zero to be sure that it is not a problem between your module and another program on my pi.
So I did a new installation of MM on another Raspberry Pi with a clean raspian.Above, there is only your modules installed (I just copy my config.js from my other MM).
Here is the MM launch screen with SSH :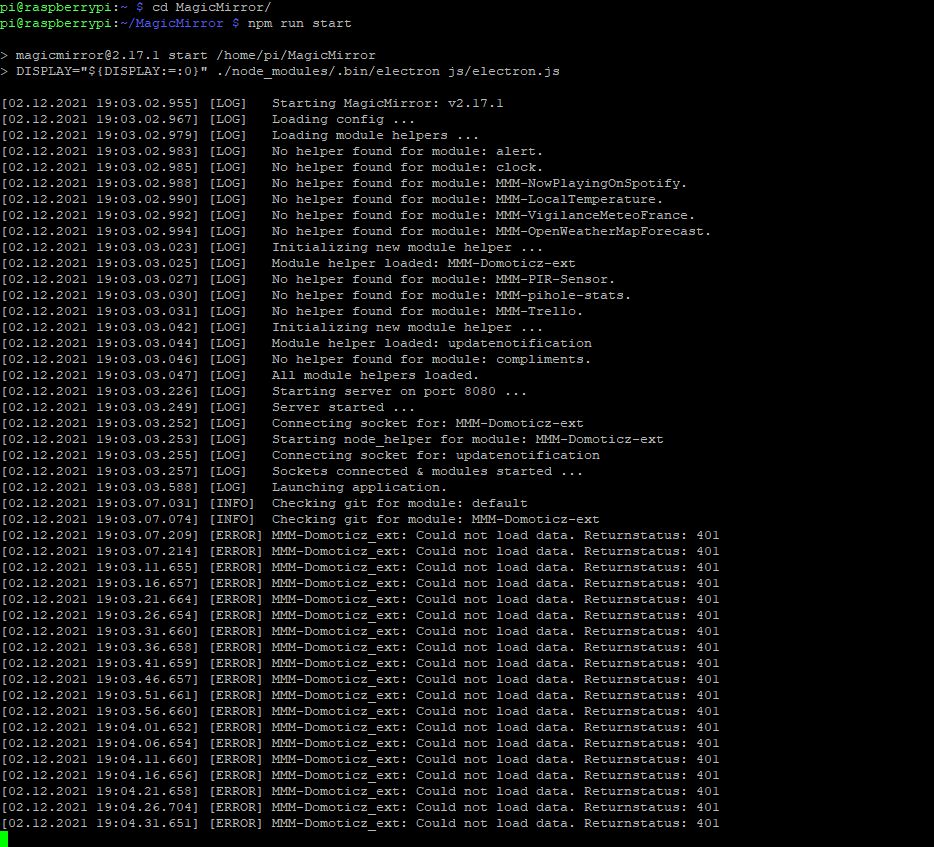
-
The errors indicate that Domiticz cannot be reached. Would it be possible to temporarily disable the authentication in Domoticz and test it again?
-
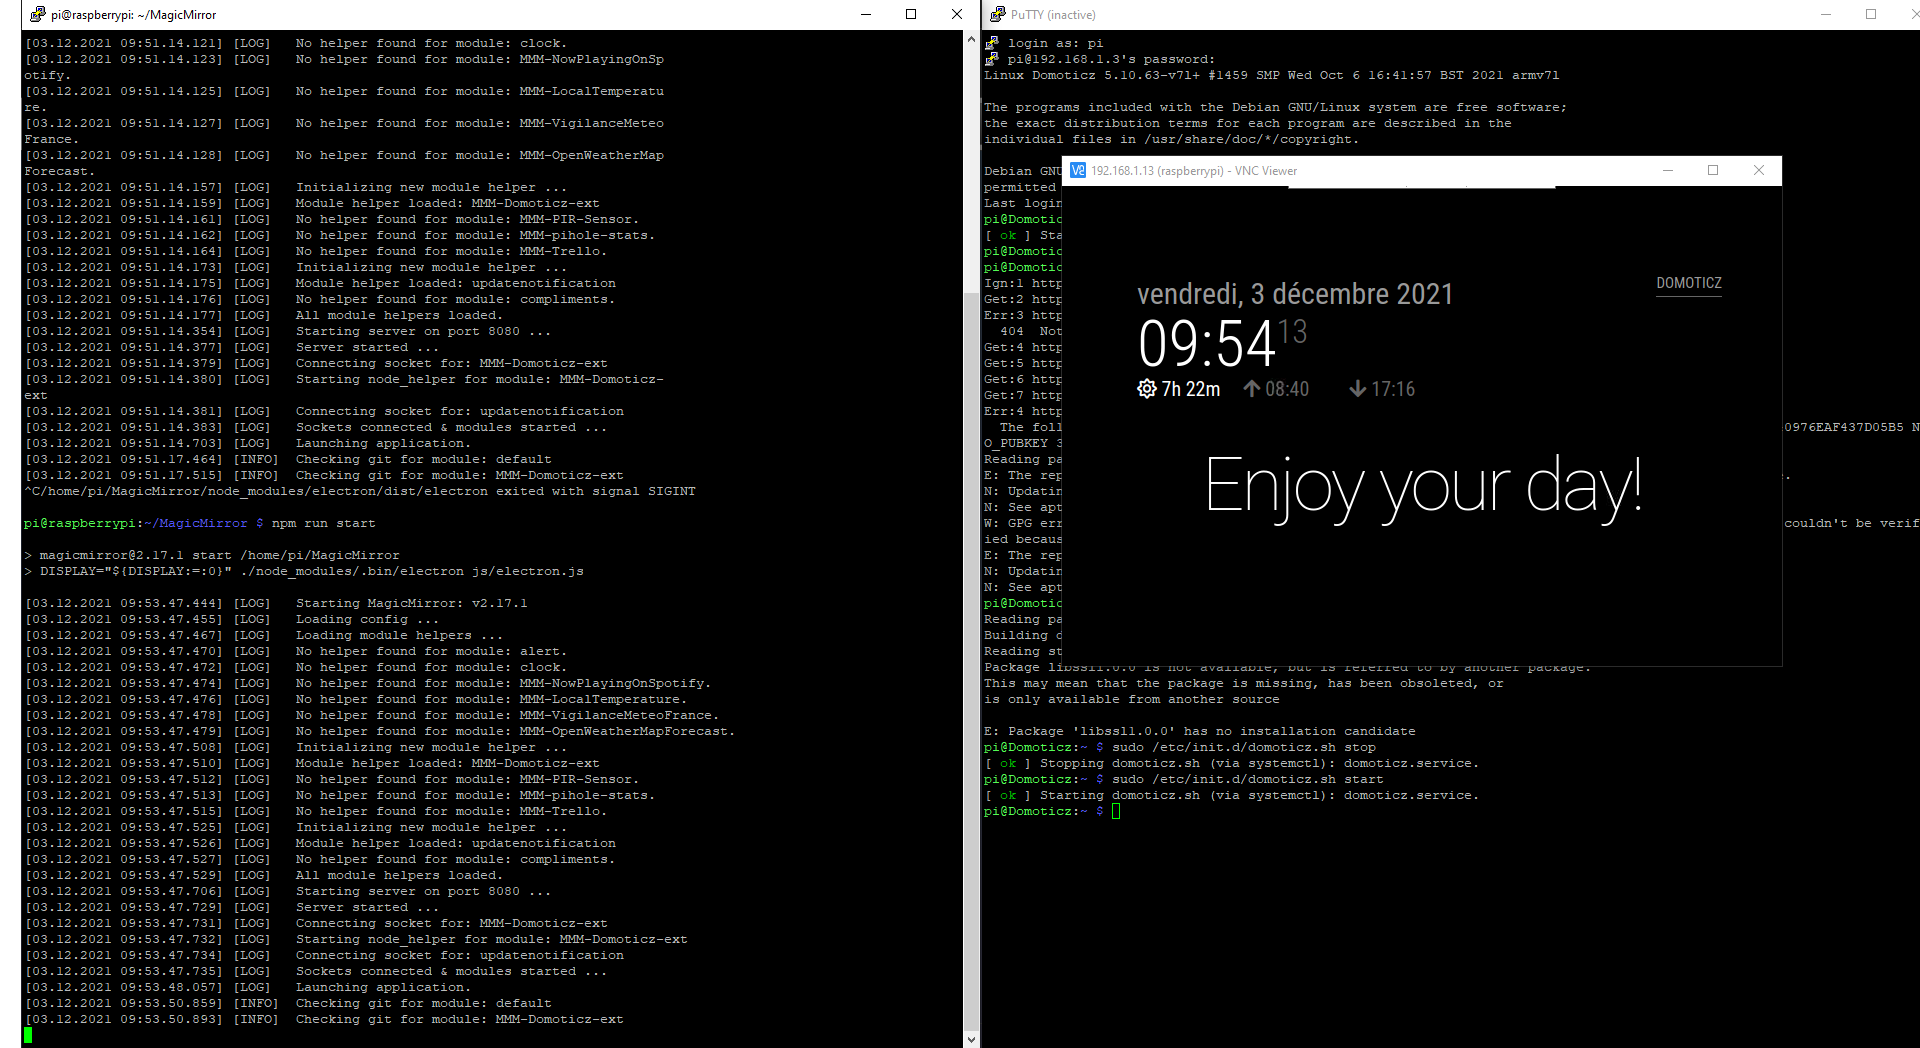
@goedh452 I don’t know how to remove the authentication on domoticz, I just added its IP to the whitelist and I got this:
-
Just remove the username en password and save the settings.

-
@goedh452 Same screen
-
@shaitan said in MMM-Domoticz-ext: interact with Domoticz:
I just added its IP to the whitelist
I just want to add for this and other folks…
when integrating multiple systems , 1st thing to do is disable all ip filtering/firewalls
in MagicMirror this isaddress:"0.0.0.0", // let any outside system connect , "localhost" means ONLY apps INSIDE this same machine can connect ipWhitelist:[], // no restrictions on specific systems connecting.once working, then u can add back whatever u might need… ,
and if it impacts the integration, then u will know as it is the last change…
-
Hello and thank you for this great module,
The installation and the settings went well but I can’t see my action buttons on my touch mirror.
The overview change buttons work well!
I integrated it into a page of MMM-Caroussel and MMM-GoogleAssistant operates my devices well but I cannot control the lights and others with touch buttons!
I hope to be clear and in the right place.If you have any ideas…
Fab -
Could you post your config of the module please? And are buttons not displayed at all or aren’t they working when you click them?
-
@goedh452
I don’t know where the buttons should be? Are these the icons on my dashboard?
Here is my config and thank you.{ module: 'MMM-Domoticz-ext' , header: "DOMOTICZ" , position: "middle_center" , config: { apiBase: "xxx.xxx.x.xx" , apiPort: "xxxx" , updateInterval: 10 , animationSpeed: 0 , displayType: "actions" , alwaysShowDashboard: false , alwaysShowActions: true , showButtons: true , showTotals: true , showIcons: true , dashboardRooms: [ "1","2","3","4","5","6","7","8","9","10","11","12","13" ], buttonAllLabel: "Tous" , buttonTypeLabel: "Par Types d'appareils" , buttonRoomLabel: "Par Pièces" , buttonBothLabel: "Par Types/Pièces" , buttonFloorLabel: "Par Types/Niveaux" , buttonDashboardLabel: "Tableau de Bord" , horizontal: true , columnCount: 15 , dashboardColumnCount: 15 , maxTitleLenght: 25 , switchLabel: "Lumières" , dimmerLabel: "Interrupteurs" , temperatureLabel: "Température Intérieure" , humidityLabel: "Humidité" , usageLabel: "Electricité Maison" , rooms: [ { idx: "7" , name: "Cellier" }, { idx: "6" , name: "Buanderie" }, { idx: "1" , name: "Salon" }, { idx: "2" , name: "Salle à Manger" }, { idx: "3" , name: "Cuisine" }, { idx: "8" , name: "Ch.Parents" }, { idx: "9" , name: "Ch.Adèle" }, { idx: "10" , name: "Ch.Louis" }, { idx: "4" , name: "Bureau" }, { idx: "11" , name: "Salle de Bain" }, { idx: "12" , name: "Salle d'Eau" }, { idx: "13" , name: "Couloir-Entrée" }, { idx: "5" , name: "Terrasse" }, ], floors: [ { name: "Rez de Chaussée" , rooms: [ "1" , "2" , "3" , "6" , "7" , "8" , "11" , "13" ] }, { name: "Etage" , rooms: [ "4" , "9" , "10" , "12" ] }, { name: "Extérieurs" , rooms: [ "5" ] }, ], utilities: { utilityLabel: "Electricité Générale Maison" , showLabel: true , devices: [ { idx: "119" , deviceHeader: "Consommation Electrique" , useHeaderSymbol: false , headerSymbol: "plug" , counterTodayLabel: "Aujourd'hui" , counterTodayAppendText: "Kwh" , gaugeMinValue: -3000 , gaugeMaxValue: 3000 , gaugeAppendText: "Watts" , gaugeWidth: 190 , lineWidth: 20 , markerWidth: 20 , markerColor: "#F4D03F" }, { idx: "121" , deviceHeader: "Consommation Electrique Nette" , useHeaderSymbol: false , headerSymbol: "plug" , counterTodayLabel: "Aujourd'hui" , counterTodayAppendText: "Kwh" , gaugeMinValue: -3000 , gaugeMaxValue: 3000 , gaugeAppendText: "Watts" , gaugeWidth: 190 , lineWidth: 20 , markerWidth: 20 , markerColor: "#F4D03F" } , { idx: "117" , deviceHeader: "Production Solaire" , useHeaderSymbol: false , headerSymbol: "sun" , counterTodayLabel: "Aujourd'hui" , counterTodayAppendText: "Kwh" , gaugeMinValue: 0 , gaugeMaxValue: 3000 , gaugeAppendText: "Watts" , gaugeWidth: 190 , lineWidth: 20 , markerWidth: 20 , markerColor: "#70db70" }, { idx: "43" , deviceHeader: "Production Eau Chaude" , useHeaderSymbol: false , headerSymbol: "faucet" , counterTodayLabel: "Aujourd'hui" , counterTodayAppendText: "Kwh" , gaugeMinValue: 0 , gaugeMaxValue: 2800 , gaugeAppendText: "Watts" , gaugeWidth: 190 , lineWidth: 20 , markerWidth: 20 , markerColor: "#1E90FF" }, { idx: "46" , deviceHeader: "Pompe à Chaleur" , useHeaderSymbol: false , headerSymbol: "hot-tub" , counterTodayLabel: "Aujourd'hui" , counterTodayAppendText: "Kwh" , gaugeMinValue: 0 , gaugeMaxValue: 2000 , gaugeAppendText: "Watts" , gaugeWidth: 190 , lineWidth: 20 , markerWidth: 20 , markerColor: "#f4763f" } , ], }, custonGauges: { headerLabel: "Autres" , showLabel: true , devices: [ { idx: "25" , deviceHeader: "Voltage" , useHeaderSymbol: true , headerSymbol: "bolt" , gaugeAppendText: "volts" , gaugeMinValue: 210 , gaugeMaxValue: 260 , gaugeWidth: 150 , lineWidth: 16 , markerWidth: 16 , markerColor: "#f4763f" }, ], }, weather: { devices: [ "140" ], weatherLabel: "Températures", gaugewidth: 60, gaugeAppendText: "°C", }, Actions: [ { label: "Lumiere Exter Cuisine Shelly", url: "http://xxx.xxx.x.xx:xxxx/json.htm?type=command¶m=switchlight&idx=66&switchcmd=On" } , { label: "Lumiere Exter Cuisine Shelly", url: "http://xxx.xxx.x.xx:xxxx/json.htm?type=command¶m=switchlight&idx=66&switchcmd=Off" } , { label: "Lumiere Exter Entree Shelly", url: "http://xxx.xxx.x.xx:xxxx/json.htm?type=command¶m=switchlight&idx=62&switchcmd=On" } , { label: "Lumiere Exter Entree Shelly", url: "http://xxx.xxx.x.xx:xxxx/json.htm?type=command¶m=switchlight&idx=62&switchcmd=Off" } , { label: "Prise Commandée 1", url: "http://xxx.xxx.x.xx:xxxx/json.htm?type=command¶m=switchlight&idx=69&switchcmd=Toggle" } , ], }, }, -
I’m not sure if this is the problem, but there are two typos in the config: custonGauges should be customGauges en Actions should be actions (lower case a).
-
@goedh452
moron that I am, a fresh expert’s eyes and the problem is solved.
Big thanksFab
-
Great! Enjoy the module!
-
@goedh452
I just have to order all that! ;-) -
@goedh452
Hello,
Sorry to come back,
I have 2 buttons for each “action / label” I created, is this normal?Fab
-
No, that’s not normal. In the config I see 5 buttons. Am I correct that the module displays 10?
-
@goedh452
yes, when I pass “displayType: actions”, I have all the buttons in duplicate (on 2 lines) but in “all”, I have the list of devices and a line of buttons below … (can be the second line is hidden for lack of space!)
I couldn’t go on tonight.
Sorry.Fab
-
@fabaude
I think this is a bug. At the moment I do not have a pi running the mirror and module, so debugging is a bit difficult. If I find some time, I’ll see if I can install it and debug. If you only want to display the actions, there should be other modules that do this. -
@sdetweil Hi, I will try this after my travel, i’m not at home… Thank you !
-
Hi,
Does anyone know if it is possible to show the values of a smart meter without using a Gauge?
I would like to show the values in a different layout, for example a room layout, I can’t manage to do this now without using a Gauge.
I hope someone can help me!
Regards, Bliepie
-
Hi,
Does anyone know if it is possible to show different gauge colors depending on the value, for example:
- temperature in the range of -10 to 10 degrees in blue
- temperature in the range of 11 to 20 degrees in green
- temperature in the range of 21 to 30 degrees in yellow
-temperature in the range of 31 to 40 degrees in red
Of course, it would be nice to use such color meters for other measurements.
Hope someone can help me!
I greet Arthur
Hello! It looks like you're interested in this conversation, but you don't have an account yet.
Getting fed up of having to scroll through the same posts each visit? When you register for an account, you'll always come back to exactly where you were before, and choose to be notified of new replies (either via email, or push notification). You'll also be able to save bookmarks and upvote posts to show your appreciation to other community members.
With your input, this post could be even better 💗
Register Login
