Read the statement by Michael Teeuw here.
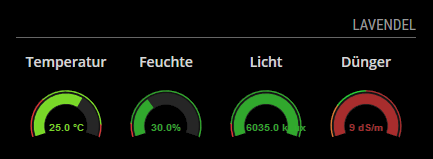
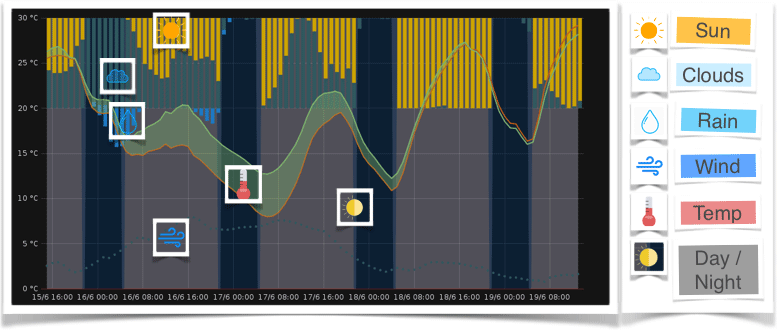
MMM-GrafanaCharts and MMM-GrafanaGauges: Display you data with Charts and Gauges. Beautifully.
-
@planet4 What other problems did grafana give you? I am also using the mmm hass component to pull in sensor date but maybe I will switch to mmm mqtt. I really wanted to show some nice graph though. Also how did you build the total solar energy sensor saving in hass? I build it in graphana following someones tutorial,
-
edit reposted to be in same thread…
Hi,
Have been using this module for a couple of years now without any problems. Yesterday I upgraded my Grafana server and discovered they had implemented a security change where you had to allow_embedded=true. After doing this change I was back on track again, except that I can only see my GrafanaGauges when I point my browser to my MagicMirror IP, it does not show up on the MM screen itself. I see it takes it places and all modules around aligns perfectly around it, but the content onscreen is blank/black. Have been troubleshooting everything from both Grafana side and MagicMirror side. It will not show up on the screen only when I point my browser to the MM, then I see the screen with all content as it should…
Now I am clueless… Not sure if this is module-specific or content from Grafana that does it. My next step to try som iFrame modules to show the same content…
Any ideas?Regards
-
edit
Case closed.
With no errors what so ever from the MM side, everything seemed to work normal. Either MM or the modules I tried did not resolve FQDN names… ! (MM is configured with two local DNS servers) I think this should be reported in some of the logs on MM… Nothing.
I figured it out when I did a lsof on my Grafana server and there were no connection from the MM there… Only my own pc… LOLWell, back in business again after some hours troubleshooting… Probably learnt a thing or two also along the way.
I tried with another module capable of showing iframes. Same problem there. It refuses to show the content on the MM monitor only on a browser from another computer. There everythings shows up as normal.
Even removed all other modules sharing the same position as this one.I am stuck…
-
Hello, thanks for your module!
I would use the bar graph? Both vertical and horizontal?
it’s possible ? If not, do I want to add this function? Thanks so much again for the module! -
Does anyone know if anything happened to dev? I haven’t seen anything from him on the internet since 2018.
Is this project dead?
-
@iorifly
The project seems to be dead :( -
Hello everyone,
I would like to set up a system that takes the data from the temperature/humidity sensors, the values recorded in a database and with Grafana graphing the values and then displaying everything on MM.
What other methods/modules are available to graph this information on MM?
From what I understand @SvenSommer modules don’t work anymore …Thanks
-
@Egnos You can use RDDTOOL, I described it here: https://forum.magicmirror.builders/topic/16575/cpu-temperature-as-a-graph-with-rrdtool?_=1666781012238
But instead of creating an extra html, you can use the output directly with MMM-EasyPix://################################################################################# { disabled: false, module: "MMM-EasyPix", position: "top_center", config: { picName: "cputemp.gif", maxWidth: "100%", // sounds: ["1.mp3", "me2.mp3"], updateInterval: 600000, animationSpeed: 1000, } }, //################################################################################# -
@planet4 Hi - I have seen your temperature module, it looks nice, I am not a developer, Would you be kind enough to share your Temperature module with me…the one with the gauge - Thank you.


