MagicMirror Forum
    • Recent
    • Tags
    • Unsolved
    • Solved
    • MagicMirror² Repository
    • Documentation
    • 3rd-Party-Modules
    • Donate
    • Discord
    • Register
    • Login
    A New Chapter for MagicMirror: The Community Takes the Lead
    Read the statement by Michael Teeuw here.

    has anyone used any of the charting tools, like chartjs?

    Scheduled Pinned Locked Moved General Discussion
    18 Posts 5 Posters 6.6k Views 5 Watching
    Loading More Posts
    • Oldest to Newest
    • Newest to Oldest
    • Most Votes
    Reply
    • Reply as topic
    Log in to reply
    This topic has been deleted. Only users with topic management privileges can see it.
    • lavolp3L Offline
      lavolp3 Module Developer @sdetweil
      last edited by

      @sdetweil Looking good! How did you realize it? MMM-Chart? Chartjs and your own module?

      How to troubleshoot modules
      MMM-soccer v2, MMM-AVStock

      S 1 Reply Last reply Reply Quote 0
      • S Offline
        sdetweil @lavolp3
        last edited by sdetweil

        @lavolp3 using chartjs and my own module. my data is not in JSON format required by MMM-Charts

        here is the chartjs code
        i have an structure, with arrays of points (by the sensor value), javascript Date, and value.
        there are also arrays that contain the axis labels.

        make div for chart
        	var c = document.createElement("div");	
        	c.style.width=self.config.width+"px";
          	c.style.height=self.config.height+"px";
        	if(!self.config.stacked)
        	   c.style.display='inline-block';
        	self.wrapper.appendChild(c);
        
                canvas= document.createElement("canvas");
         	canvas.id="myChart"+this_pin;
                c.appendChild(canvas);
        
        for(var pin_index=0; 
              pin_index < self.config.Pins.length;  (how do you do less than in markup?, space after < )
              pin_index++)
        {
        var this_pin=self.config.Pins[pin_index];
        
               self.charts[pin_index] = new Chart(canvas, {
                      type: 'line',
                      showLine: true,							
                      data: {
                        datasets: [
                          {
        		    xAxisID: 'dates',
                            data: self.data[this_pin], 
                            fill:true,
                            borderColor: '#2196f3', 
           		    backgroundColor: '#2196f3', 
        	             },
                        ]
                      },
                      options:	 { 
        			legend: { display: false},
        			tooltips: {
        			    enabled: false,
        			    displayColors: false
        			  },
        			responsive: false,
        			elements: {
        			    point: { radius: 0 },
        			    line: {
                		        tension: 0, // disables bezier curves
        			     }
                		},
                        scales: {
                          xAxes: [{
        			id: 'dates',
                            type: 'time',
        			distribution: 'linear',
                            scaleLabel: {
                                display: true,
                                labelString: self.config.labels[pin_index]+" - last "+self.config.dayrange+" days",
        			fontColor: 'white'
                            },
        			gridLines: {
        				display: false,
        				zeroLineColor: '#ffcc33'
        			},
          		        time: {
              		              unit: 'minute'
                  		      },
        			bounds: 'data',
                            ticks: {
        			display: false ,
        			maxRotation: 90,
        			source: 'data',
        			maxTicksLimit: self.data[this_pin].length,                    },
                          }],
                          yAxes: [{
                                display: true,
                                scaleLabel: {
                                    display: true,
                                    labelString: self.config.yaxis_legend[pin_index],
        			    fontColor: 'white'
                                },
        			gridLines: {
        			   display: true,
        			   color: "#FFFFFF",
        			   zeroLineColor: '#ffcc33',
        			   fontColor: 'white',									 
                                   scaleFontColor: 'white',
        			},
        
                            ticks: {
        			beginAtZero: true,
        			source: 'data',
                                min: 0,
        			fontColor: 'white'
                            },
                            }]
                        },
                      }
                    });
        }
        

        Sam

        How to add modules

        learning how to use browser developers window for css changes

        lavolp3L 1 Reply Last reply Reply Quote 1
        • lavolp3L Offline
          lavolp3 Module Developer @sdetweil
          last edited by

          @sdetweil Thanks for sharing!!
          I’ll try that out with the rain-forecast module

          How to troubleshoot modules
          MMM-soccer v2, MMM-AVStock

          S 1 Reply Last reply Reply Quote 0
          • S Offline
            sdetweil @lavolp3
            last edited by

            @lavolp3 i have over 4000 measurements in each chart. (3 days, once a minute)

            still pretty reasonable performance.

            update once every 5 minutes, or when come back from sleeping (no updates while MM is asleep).

            Sam

            How to add modules

            learning how to use browser developers window for css changes

            S 1 Reply Last reply Reply Quote 1
            • S Offline
              sdetweil @sdetweil
              last edited by sdetweil

              I have updated the code now to improve performance…

              • reduce number of data points, by decimation (using 1 point of every 5) to get to 800 points. See info once every 5th minutes, vs once a minute
              • build 800 point data from in memory CSV (api sends back csv data) by looking from NOW (end) til previous (backwards) which reduces the number of lines of data processed from 14000 to 4000 (configurable number of days for chart)
              • create a color gradient table start-end: color, start-end:color2… to draw multiple colors on chart, as part of the data selection in 1 and 2 above… this make the processor O(1) (single pass), instead of O(4)

              performance is much improved…
              prior, 4000 points, elapsed time for 2 charts, 39 seconds. now 3.5 seconds (odroid). pi crashed with 4000 points at 4 minutes elapsed… now just about 4.5 seconds

              Sam

              How to add modules

              learning how to use browser developers window for css changes

              Mykle1M 1 Reply Last reply Reply Quote 1
              • Mykle1M Offline
                Mykle1 Project Sponsor Module Developer @sdetweil
                last edited by

                @sdetweil

                I have no idea what you just said but I upvoted your post anyway. :-)

                Create a working config
                How to add modules

                1 Reply Last reply Reply Quote 0
                • T Offline
                  Tarun
                  last edited by

                  no i never use charting tool what is the function of that tool???

                  lavolp3L 1 Reply Last reply Reply Quote 0
                  • lavolp3L Offline
                    lavolp3 Module Developer @Tarun
                    last edited by

                    @tarun well… basically to create charts from data …

                    How to troubleshoot modules
                    MMM-soccer v2, MMM-AVStock

                    1 Reply Last reply Reply Quote 0
                    • lavolp3L Offline
                      lavolp3 Module Developer
                      last edited by

                      I have now used chartjs as well on the MMM-rain-forecast module by @cirdan and SpoturDeal.

                      0_1550140690475_6c9bcdf8-3165-4bba-b0c5-e9b16eade267-image.png
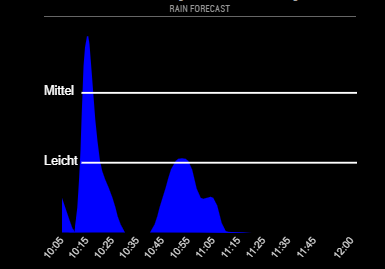
                      I like it and there are some plugins to use as well.
                      First results can be achieved very quickly, but if you want to change further specific things, it’s getting difficult with the various objects.

                      @sdetweil do you know of a complete set of options for chartjs? I find the documentation a bit too short and confusing.

                      How to troubleshoot modules
                      MMM-soccer v2, MMM-AVStock

                      S 1 Reply Last reply Reply Quote 0
                      • S Offline
                        sdetweil @lavolp3
                        last edited by

                        @lavolp3 i do not… there are tons of options, which I guess you would expect.

                        Sam

                        How to add modules

                        learning how to use browser developers window for css changes

                        1 Reply Last reply Reply Quote 0
                        • 1
                        • 2
                        • 2 / 2
                        • First post
                          Last post
                        Enjoying MagicMirror? Please consider a donation!
                        MagicMirror created by Michael Teeuw.
                        Forum managed by Sam, technical setup by Karsten.
                        This forum is using NodeBB as its core | Contributors
                        Contact | Privacy Policy