@lavolp3 Thanks for your post. I will have a look into this, hopefully in the next week! I’m still convinced we should build this module.
A New Chapter for MagicMirror: The Community Takes the Lead
Read the statement by Michael Teeuw here.
Read the statement by Michael Teeuw here.
Posts
-
RE: MMM-OralB / Bluetooth equipped toothbrush integration
-
RE: MMM-GrafanaCharts and MMM-GrafanaGauges: Display you data with Charts and Gauges. Beautifully.
@planet4 Hey, I just tried it with the actual Grafana v6.0.1 (commit: 0c44a04)
It worked for me without any adjustments.Maybe I can support you, to set it up.
-
RE: MMM-OralB / Bluetooth equipped toothbrush integration
I’m still hoping some genius starts to hack the protocol. This is the tricky part. Once this is done, building a module for the MM-framework is a walk in the park.
-
RE: MMM-GrafanaCharts and MMM-GrafanaGauges: Display you data with Charts and Gauges. Beautifully.
@sceletus
Enable authentication in the [http] section of the configuration file /etc/influxdb/influxdb.conf :[http] enabled = true bind-address = ":8086" # change to a specific interface if needed auth-enabled = true # will enforce authenticationeverything is described in the tutorial on http://robstechlog.com/2017/06/30/personal-weather-chart-module/
-
RE: MMM-cryptocurrency - v1.4
Hey @matteodanelli ,
thank you for this great module.
I added an alternative display mode to see the changes within the logo view.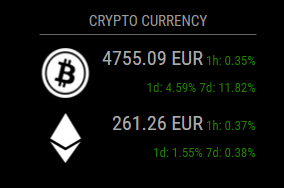
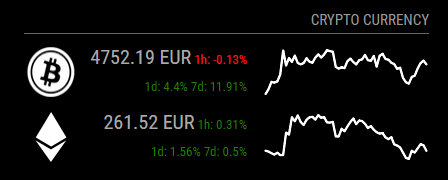
I made a pull request. Here are the changes:
- 1 hour , 1 day and 7days changes can be displayed by adding ‘logoWithChanges’ as display type.
- option and screenshots added to README.md
-
RE: A thin MM with metal frame, hidden IR camera and 32" Inch HDTV
A touch display of this size is a big cost factor.
In addition you would always have some fingerprints on the mirror.
A better solution is maybe a gesture control. -
RE: A thin MM with metal frame, hidden IR camera and 32" Inch HDTV
@Arthur
Not by now, but definitely before Christmas ;-) -
RE: MMM-GrafanaCharts and MMM-GrafanaGauges: Display you data with Charts and Gauges. Beautifully.
@fox Yes, this script is responsible for getting the data into the database.
If you would like to show other data with Grafana, you need to save the data you get from your sensor.
-
RE: MMM-GrafanaCharts and MMM-GrafanaGauges: Display you data with Charts and Gauges. Beautifully.
@fox
Short answer: No, not the direct way.Long answer: You need to write your temperature data into a database which is connected with Grafana. Then you can use this module to display your graph created by grafana.
One possible solution: This tutorial shows an example, on how to store weather data from an external source in a local influxdb database, which is connected to grafana.
You could reuse the example code an edit it, to get your data stored in a influxdb database. -
RE: MMM-GrafanaCharts and MMM-GrafanaGauges: Display you data with Charts and Gauges. Beautifully.
@planet4 good news!
Can you please share which CSS file, and what you edited? -
RE: Calendar times in 24 hour format?
Is your google calendar in the correct time zone?
-
RE: MMM-Globe
I just found this source here and thought about this module.
http://earth.nullschool.net/ -
RE: Calendar times in 24 hour format?
I think there is simply an understanding problem. You wrote:
“When i change timeFormat to 12 calendar add PM to 03:00 so it’s correctly, but when i change to 24, PM disappear.”So, if I’m interpreting this right, you are looking for something that isn’t the usual case. You want to display something like: “20:59 PM”
Is this correct? -
RE: Calendar times in 24 hour format?
@MrEdOne
timeFormatuses the formatting of your operating system.
When “24” is configured the format “hh:mm” is returned. Which is exactly, what you are looking for.
Here is the code snippet from calender.js:switch (config.timeFormat) { case 12: { moment.updateLocale(config.language, { longDateFormat: { LT: "h:mm A" } }); break; } case 24: { moment.updateLocale(config.language, { longDateFormat: { LT: "hh:mm" } }); break; }What do you get, when typing
datein your console?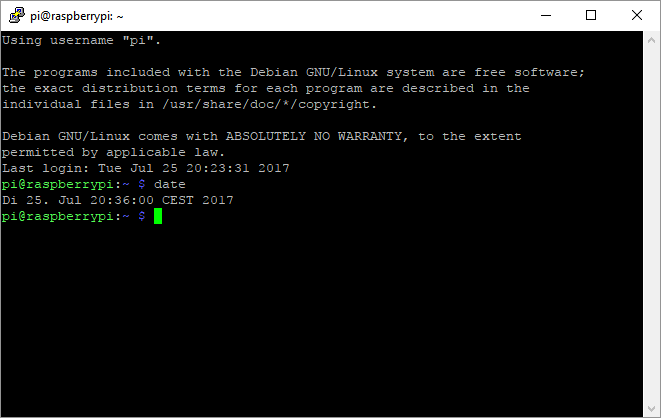
If it’s not in displayed in a format of 24h, change the setting of your OS.Maybe this helps?
-
RE: Graph module
@planet4 I’m glad to hear, everything worked out as expected.
-
If you want to do me a favor. Please let others know in the module teaser thread, you were able to use the module. So maybe other lose their fear. ;)
-
I had a look at changing the background color by inverting the colors of the “white” theme. Didn’t worked out, cause it’s no real white neither.
-
-
RE: Graph module
@feedparakeet
I think there is even a better way. You can share each panel individually.
http://docs.grafana.org/reference/sharing/ -
RE: stronger Raspberry Pi 3 Alternatives
@Snille Yes, very interesting. I liked the idea of comparing the boards with Geekbench. Maybe this is a measurable unit to compare.
@cowboysdude Are you willing to run such a Geekbench on your system?Somebody backed this and is going to get a one?
-
RE: Graph module
@planet4 The tutorial explaines how to enable authentication via http to access influxdb without login.
You’re changing parts of the configuration file
/etc/influxdb/influxdb.conf[http] enabled = true bind-address = ":8086" # change to a specific interface if needed auth-enabled = true # will enforce authentication ...To access your Grafana graphs remotely, you can use the share option to get a public accessible link. The same url uses MMM-GrafanaChart to show the graph on the mirror.
Let me know if you ran in any problems…