Read the statement by Michael Teeuw here.
MMM-Domoticz-ext: interact with Domoticz
-
@goedh452
Looking at my post is spotted some differances in the gauges. they were my mistakes :P -
Hi and thanks again for your efforts.
Gauge swapping positions
I can confirm that this occurs occasionally, on a manual browser refresh if seems to have a 15% chance of occurring. ( i did 30 refreshes. and got 2 swaps) i only see the last 2 gauges, out of the 5 that i have showing, do the swap.Custom Gauges
These work well and as expected. - thank you!
here is the config I am using:
{ module: "MMM-Domoticz-ext", //header: "Domoticz - new", //position: "bottom_left", position: "bottom_bar", config: { apiBase: "10.60.2.252", apiPort: "8080", //apiUser: "XXXX", // only works with domoticz "Setup|Settngs|Website protection = "Basic auth" add the MM Ip to the "Local Networks" list to allow access with no auth, then all sensors will be listed. //apihPW: "YYYY", //alwaysShowDashboard: true, horizontal: "true", columnCount: 3, displayType: "all", // show all switchs/lights status //displayType: "dashboard", // dashboard //dashboardColumnCount: 3, //switchIcon: "lightbulb", weather: { devices: [ "199", "200" ], //snake temps weatherLabel: "Temperatures", gaugeWidth: 200, gaugeWindAppendText: "km/h", rainSuffix: "mm", }, utilities: { utilityLabel: "Gas - Water - Elec", showLabel: false, devices: [ { idx: "164", deviceHeader: "Solar Gen", useHeaderSymbol: false, headerSymbol: "solar-panel", counterTodayLabel: "Today", gaugeMinValue: 0, gaugeMaxValue: 2000, gaugeAppendText: "Watts", gaugeWidth: 150, lineWidth: 12, markerWidth: 12, markerColor: "#F4D03F" }, { idx: "191", deviceHeader: "PowGen/PowUse", useHeaderSymbol: false, headerSymbol: "solar-panel", counterTodayLabel: "Today", gaugeMinValue: -2000, gaugeMaxValue: 2000, gaugeAppendText: "Watts", gaugeWidth: 150, lineWidth: 12, markerWidth: 12, markerColor: "#F4003F" }, ], }, customGauges: { headerLabel: "Monitoring", showLabel: false, devices: [ { idx: "209", deviceHeader: "Toaster", lowerText: "Voltage", gaugeAppendText: "volts", gaugeMaxValue: 255, gaugeWidth: 150, lineWidth: 12, markerWidth: 12, markerColor: "#70db70" }, { idx: "208", deviceHeader: "Toaster", gaugeAppendText: "Amps", lowerText: "Current", gaugeAppendText: "volts", gaugeMaxValue: 16, gaugeWidth: 150, lineWidth: 12, markerWidth: 12, markerColor: "#70db70" }, { idx: "232", deviceHeader: "Brightness", lowerText: "Manual Override", gaugeAppendText: "%", gaugeMaxValue: 100, gaugeWidth: 150, lineWidth: 12, markerWidth: 12, markerColor: "#707070", }, ], }, rooms: [ { idx: "17", name: "Status" }, // can only show switch status,, breaks if temp. in room? //{ idx: "14", name: "Testing" }, ], }, },
– Peter
-
Hi Peter,
Great it is working out for you! In the config there is a question that the lower part breaks when it encounters a temperature. Is that right? It should be able to show temperatures as well.
-
Hi
rooms: [ { idx: "17", name: "Status" }, // can only show switch status,, breaks if temp. in room? //{ idx: "14", name: "Testing" }, ],
I have a “room” plan set in Domoticz that contains various virtual devices, if i add a temperature device to it, the list of devices shown in MM stops at that device.
With “mote” (temp & humidity) sensor in the room
With no mote in the room.
Please note: I have used custom css to shrink the members of the room to a more compact left justified list, rather than spread across the whole width of the screen.
regards Peter
-
I can have a look at the temp/hum issue. I have several of these sensors myself and they do work in this layout. I would need the JSON-output of the specified device to figure out the problem.
-
I tried, but am unable to reproduce your problem. If you would like me to have a look, please post the JSON result for the device “mote”.
-
Hi
Sorry for the delayed response.
It appears that the issue occurs when there is no temperature or humidity data in the json output.
the sensor had no data while i was initially testing. After collecting some data it works as expected.
sample json data:pi@MM-lite:~$ curl "http://10.60.2.252:8080/json.htm?type=devices&rid=196" { "ActTime" : 1623221642, "AstrTwilightEnd" : "18:46", "AstrTwilightStart" : "05:45", "CivTwilightEnd" : "17:46", "CivTwilightStart" : "06:45", "DayLength" : "10:07", "NautTwilightEnd" : "18:16", "NautTwilightStart" : "06:15", "ServerTime" : "2021-06-09 14:54:02", "SunAtSouth" : "12:16", "Sunrise" : "07:12", "Sunset" : "17:19", "app_version" : "2020.2 (build 12917)", "result" : [ { "AddjMulti" : 1.0, "AddjMulti2" : 1.0, "AddjValue" : 0.0, "AddjValue2" : 0.0, "BatteryLevel" : 255, "CustomImage" : 0, "Data" : "0, 27.0", "Description" : "temperature and humidity in my office. polled from mqtt", "Favorite" : 0, "HardwareDisabled" : false, "HardwareID" : 3, "HardwareName" : "virtual hardware", "HardwareType" : "Dummy (Does nothing, use for virtual switches only)", "HardwareTypeVal" : 15, "ID" : "14114", "LastUpdate" : "2021-01-04 17:58:14", "Name" : "mote", "Notifications" : "false", "PlanID" : "0", "PlanIDs" : [ 0 ], "Protected" : false, "ShowNotifications" : true, "SignalLevel" : "-", "SubType" : "THGN122/123/132, THGR122/228/238/268", "Timers" : "false", "Type" : "Temp + Humidity", "TypeImg" : "temperature", "Unit" : 1, "Used" : 1, "XOffset" : "0", "YOffset" : "0", "idx" : "196" } ], "status" : "OK", "title" : "Devices" }
With Temperature and humidity
pi@MM-lite:~$ curl "http://10.60.2.252:8080/json.htm?type=devices&rid=196" { "ActTime" : 1623222662, "AstrTwilightEnd" : "18:46", "AstrTwilightStart" : "05:45", "CivTwilightEnd" : "17:46", "CivTwilightStart" : "06:45", "DayLength" : "10:07", "NautTwilightEnd" : "18:16", "NautTwilightStart" : "06:15", "ServerTime" : "2021-06-09 15:11:02", "SunAtSouth" : "12:16", "Sunrise" : "07:12", "Sunset" : "17:19", "app_version" : "2020.2 (build 12917)", "result" : [ { "AddjMulti" : 1.0, "AddjMulti2" : 1.0, "AddjValue" : 0.0, "AddjValue2" : 0.0, "BatteryLevel" : 14, "CustomImage" : 0, "Data" : "32.2 C, 34 %", "Description" : "temperature and humidity in my office. polled from mqtt", "DewPoint" : "14.35", "Favorite" : 0, "HardwareDisabled" : false, "HardwareID" : 3, "HardwareName" : "virtual hardware", "HardwareType" : "Dummy (Does nothing, use for virtual switches only)", "HardwareTypeVal" : 15, "HaveTimeout" : false, "Humidity" : 34, "HumidityStatus" : "Comfortable", "ID" : "14114", "LastUpdate" : "2021-06-09 15:10:35", "Name" : "mote", "Notifications" : "false", "PlanID" : "0", "PlanIDs" : [ 0 ], "Protected" : false, "ShowNotifications" : true, "SignalLevel" : "-", "SubType" : "THGN122/123/132, THGR122/228/238/268", "Temp" : 32.19, "Timers" : "false", "Type" : "Temp + Humidity", "TypeImg" : "temperature", "Unit" : 1, "Used" : 1, "XOffset" : "0", "YOffset" : "0", "idx" : "196", "trend" : 1 } ], "status" : "OK", "title" : "Devices" }
mote sensor appears now, above the snake enclosure light.
thanks again for your attention
-
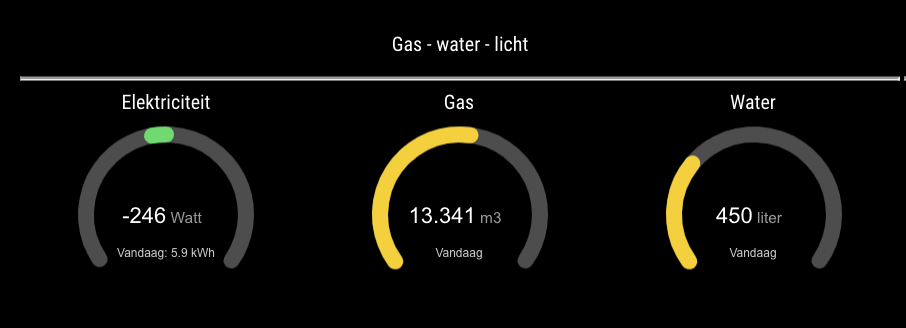
Hi tanks for great module. I have a small problem with the counter today from the power consumption. this doesn’t show me the amount of use of the day. Gas and water working fine. see screenshot. Do you have a solution, or where I have to search? !!
-
This post is deleted! -
Alle data is retrieved from the JSON response. Could you post it for the electricity counter?