Read the statement by Michael Teeuw here.
show integer logs from python script as diagram in MM ?
-
wow, thank u guys for your effort :)
personally for me this project is not that easy, because i need to learn and understand several languages at the same time. So pls be patient ^^
While u posted here i was able to create a JSON file from the mysql database. But the results were looking like this:
[{"Datum":"2018-02-03T23:00:00.000Z","Volumen":2488},{"Datum":"2018-02-03T23:00:00.000Z","Volumen":2488},]thats probably because the columns in the database are defined as “date” (not datetime) and “decimal”
I think i would get this right and could load this into the MMM-Chart.But now u guys posted several solutions. The easiest would be to create a CSV and log this directly with the MMM-Chart @ninjabreadman said.
To create the CSV is no problem for me, but how changing the MMM-Chart… i need to pass a.t.m. ^^Actually i’m not sure how node.js and npm works so i need to read and try a little bit more to understand it better :)
@doubleT
How exactly would highcharts work together with the MM? Is it just like a web page or what? :D
How to start it, where to put the files, and how to implement to MM?
For me it looks nearly like an own module for the MM.Sorry for the much questions, but i am trying not just to use a finished solution. I want to nearly understand that whole stuff XD
Thank you guys, u are great
edit:
So i changed the columns definition from “date” to “text”.
Now my with the javascript using node i can get a JSON file looks correct:[{"Datum":"2018-02-04","Volumen":2490},{"Datum":"2018-02-04","Volumen":2488},]but i am using a very very simple script i think and i am just able to execute it manually by typing in terminal “node script.js”
also i don’t know in what direction this has to be saved.var mysql = require('mysql'); var fs = require('fs'); var connection = mysql.createConnection({ host: 'xxx.xxx.xxx.xxx', port: '3307', user: '...', password: '...', database: 'Tank' }); connection.connect(); connection.query('SELECT * from Volumen', function(err, results, fields) { if(err) throw err; fs.writeFile('results.json', JSON.stringify(results), function (err) { if (err) throw err; console.log('Saved!'); }); }); connection.end(); -
Sorry, I didn’t want to confuse you. I’d suggest Highcharts if you want to build your own module (which I thought you were going for in the beginning). It’s a library that you load (you load the scripts) and use. You address it, tell it the id of the element where the chart should sit and the data it should show along with some parameters on how to show it.
But maybe in your case you really want to use MMM-Chart. On first look it seems like the JSON you have there should be totally enough! No CSV needed, as far as I can see from the readme.
What he has is similar to your JSON:
[["2017-04-21 15:58:00",8.3,95.5],["2017-04-21 14:55:00",9.3,90.5],["2017-04-21 12:56:00",10.7,87.7],["2017-04-21 11:53:00",10.5,87.7],["2017-04-21 11:01:00",10.6,88.8]]It’s just that he has arrays in an array and you have objects with keys and values in an array.
I didn’t check, but maybe MMM-Chart works with your style, too. Else, you could try to get your JSON to write as arrays in an array:[["2018-02-03T23:00:00.000Z",2488],["2018-02-03T23:00:00.000Z",2488]]From then on, MMM-Chart should print your chart.
BTW. please check if you can edit your process/function that writes your JSON so there is no comma after the last object (or array, if you change it).
-
@doubleT
i edited my post while u wrote this ^^for the first i didn’t want to create a own module, but maybe later, when i understand the stuff good.
as u can read in my edit, i can create a JSON with the script i posted. but i don’t know where to put the script to execute it automatically every 24 hours or something like that.
because i think using cronjob would be the wrong way, right? :D
edit:
i just tried the MMM-Charts module, but i even cannot get this to work with a sample JSON.
i created a test.json and loaded it up to my NAS.[["2018-02-04",2490],["2018-02-05",2488]]in the MM config.js i used this config:
{
                        module: 'MMM-Chart',
                        position: 'middle_center',
                        header: 'Tankvolumen',
                        config: {
                                name: "test",
                                url: "http://192.168.178.220/test.json",
                                xaxisLabelTicks: true,
                                maintainAspectRatio: false,
                                graphLabel0: "Volumen",
                                graphLineColor0: "rgba(200, 200, 200, 1)",
                                graphTickColor0: "rgba(200, 200, 200, 0.8)",
                                graphFillColor0: "rgba(200, 200, 200, 0.4)",
                                xaxisTimeUnit: "hour",
                                xaxisTimeFormatLabels: "HH:mm",
                        }
                },
and modified the custom.css as said in the readme like this:
.test {
	width: 1060px;
	height: 180px;
}
But it just shows the header and a long line below.
i am sure i don’t use the module the correct way. ^^ -
@cruunnerr said in show integer logs from python script as diagram in MM ?:
as u can read in my edit, i can create a JSON with the script i posted. but i don’t know where to put the script to execute it automatically every 24 hours or something like that.
because i think using cronjob would be the wrong way, right? :DThat’s exactly what a cronjob is for. ;)
But yeah, that’s on the serving side. You have to make sure the file is updated (read, altered, saved) or overwritten entirely.
I checked MMM-Chart and have the same issue, not even his own example is working. Tried some debugging but didn’t get very far. I don’t know what’s wrong.
Let’s take a step back because I think there are some things that are not necessarry.
You read the volume with a RasPi and it’s logged to a file on your NAS. Regular updates to that file work already?
It’s also saved to a MySQL database?
You have a Script that makes a JSON from the database? But it’s not yet regularly updated? Does this Script run on the measuring RasPi or the Mirror?I’d make the measuirng Pi save a JSON to the NAS. Make sure it’s working and the format is clean. MySQL database and another script are not necessarry that way. Then I’d make the Mirror read the JSON.
Shoot me a PM (in German), I think I have an idea.
-
As promised, I changed a few things to my module and now it should work with your JSON (the one with the format you told me in PM:)
[{"Datum":"2018-02-04","Volumen":2500},{"Datum":"2018-02-04","Volumen":2500}]In the future, I’d like to make this more independent with the key being set in the config (not everyone wants “Volumen” as key). There are some other to-do’s as well, but I had it running.
Check it out and let me know: https://github.com/TTigges/MMM-Oiltank
One note: It should work if you address your file with
file: "http://192.168.0.123/yourfile.json"or whatever the ip of your NAS is. Check the readme for more info.It’s not yet ready to be presented as a full running module, so I’ll keep it low key in here for now.
-
Hey mate,
tried your module and it works :D
So atm i am using the python script to write the results to the mysql database. 2 minutes later runs a node app, which creates a JSON file and put that to my NAS.
Your module grabs this JSON every hour and shows the results on my mirror :)
For me the next step is to let the python script directly write a JSON file, but i need to find a solution for that.I appreciate with your ToDo list.
It would be cool to set more things in the default config part. Things like refreshTime, high and width and if the chart will show dynamically or static. Last thing means, if the chart will show on the left side the scale from fix points (e.g. min. 0 Litre and max. 3000 Litre) or if it will show the scale depending on the last datas from the JSON (like atm).
Just a thought… ^^And a very cool killer feature would be, to calculate the date, when the tank will be totally empty depending on the consumption from the last 100 days or something like that. But i think that would be too much. :D
Anyhow i am just brainstorming. U did a great work, which i can directly use for my mirror and you have my greatest respect. Thank you and please let me know when i can help u with your ToDo list ^^
So now i will take a look on your codes and try to understand what you did XD
-
You are welcome. You’re also welcome to play with the code and adapt it to your needs and if you have suggestions on what to change, let me know.
The module is ment to sit at the bottom and fill the whole width. Where would you like to place it alternatively? Some of that positioning is adjusted in the css right now, so depending on the position it would need different css settings.
The prediction on when the tank will be empty is on my to do list (check the Code). Shouldn’t be too hard. But it’d involve read Ingo the dates and that’s something I kept out for now (internationally different time formats and all that).
-
@doubleT Thats my actual sorting:

I would like to show it in the middle below the clock.
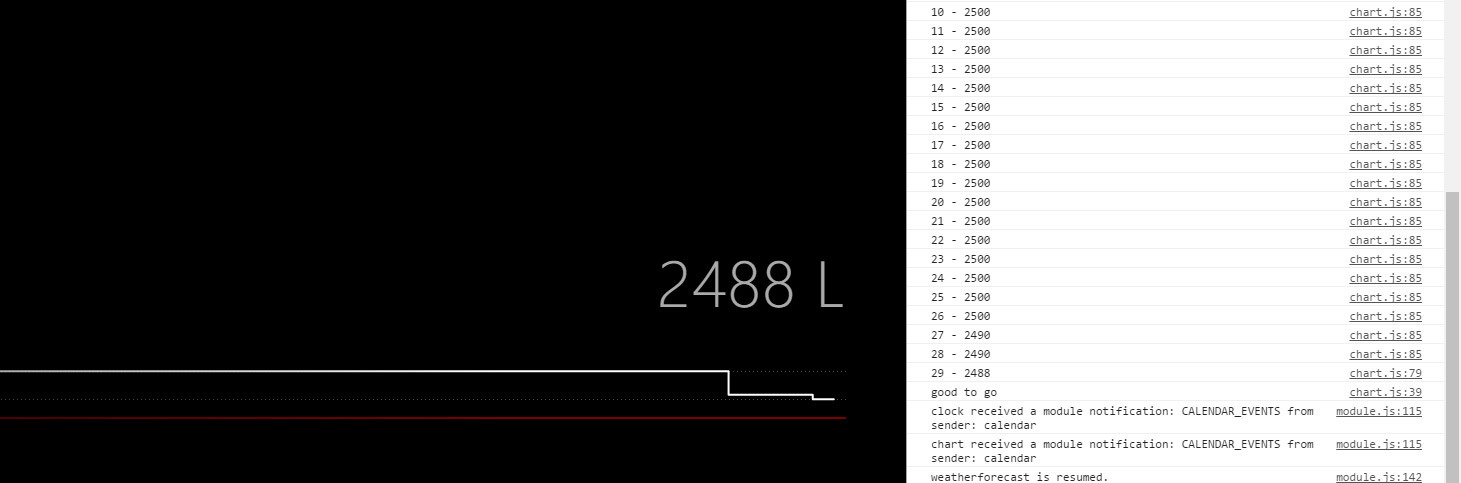
I installed the microwave sensor on my tank now and began measuring :)
So a.t.m. there is only one log and now graph is shown ^^ Will wait now for the next log to see if everything is working fine :)I will play around with the code but today and tomorrow my nephew is to visit, so i need to move that :D

