Read the statement by Michael Teeuw here.
Extension of MMM-Tools (Bugsounet)
-
-
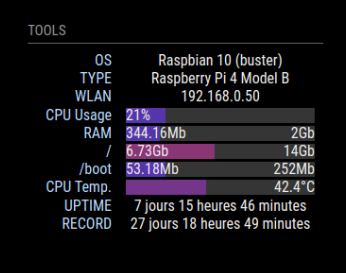
I force all value to display, I don’t really add some feature to personalize actually
you can’t actually config:
recordUptime: true,to record and display : record uptime
partitionExclude : [],fo exclude partition to display
sample:partitionExclude : [ "/boot" ],if you don’t want display info about/bootpartition -
I have to ajust css code
-
not coded yet (personal feature will be coded in the end)
-
I’m trying to do a translation file (wait a while ;) )
just tell me what value to translate (and translation needed)
For Lan to eth0. I have fetch the name info by not displayed actually (because in my dev the WLAN interface have a very very long name)
so i have planned a feature for name choice displaying (native or WLAN/LAN) -
I will do dual code (actually it’s a test)
I will be back to you when i have done some totentials change
-
-
Yeah !
- I have just commit some change on dev branch
- I add the new configuration part in Readme
- I correct some css code
- I correct unit Go to Gb
- added translation file (
detoo)
actually supported :en,fr,de(thx to @lxne),id(80% done) andsv(thx to @el97 from github),it(thx to @MrDondoT from github)
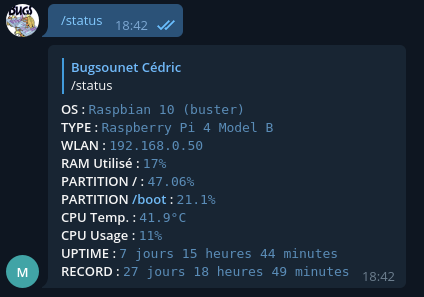
I can add other language just help me to do the translate file - added telegramBot command
/status
MagicMirror:
TelegamBot:
-
new change:
useMagicMirror: true,inUPTIME: {}
for choice of system uptime (since boot) or magic mirror uptime -
I’m liking these developments, I’m watching with great interest :)
-
I finalize ;) and go to master !
You can try it, if you want
cd ~/MagicMirror/modules
git clone -b dev https://github.com/bugsounet/MMM-Tools
cd MMM-Tools
npm install
and read the dev readme for config
Edit for ALL!
- Dev is now freeze and waiting for YOUR debug, corrects or additions
- For me it’s ready for release :)
- Give me your Feedback !
- I can display all user connected but … really interesting, i don’t know ??
- Maybe i have forget something ?
I do this module for you !
actually for my usage, it’s ok
so tell me what do you want to display ;) -
-
MMM-Tools v2.0.0 is now Released !
Please Read wiki for new configuration
-
@Bugsounet I will download it this week and report back ! :D
-
no problem, in all case, I release it (It is necessary, otherwise I will never do it!)
It’s not because I’m releasing that I’m going to drop the project!
if necessary I will add new request or correct some bug (maybe if happen)when i promise something i try to do my best for you all ! :)
-
@Bugsounet - fyi using the module with MMM-TelegramBot happens that “The usage of CPU is …” over 100% (129 percent), I even got 238 percent
-
yes i know, i try an average value of cpu usage, i don’t know about the unit return value … I have X100 value but i think it’s not that
so disable it (set it to 0), i will see
-
so … what is he unit of this:
load average: 0,97, 0,72, 0,62i see some value > 1.5
so it’s not in %I don’t want to check with the actual CPU usage value, because it’s not for a warning. i think average is a good choice but … my npm library for average not works like I want … humm
-
@Bugsounet remember there are multiple cores. all at 100% usage is maybe 200%
-
so … RPI have 4 cores => can display 400% ?
if it’s that … I have to determinate the number of core (the npm libray can do that)
and divide the result by the number of coressomething like that :
avg = (averageValue * 100) / nbCore -
So:
avg = (averageValue * 100) / nbCore—> don’t workingI have coded my own method
I take 10 last values to do an average
now it’s works and fixed with v2.0.1 :) -
This post is deleted! -
I’ve installed this and everything seems to be working fine :)
-
@Bugsounet :thumbs_up: installed and it works great!
-
Today i updated the MMM-Tools from my old Version (Sean) to Your New Version 2.01.
It Looks great, but i have a Problem.
Your Module is in my mirror on Position Bottom Right - but the Information are standing the Center of the Module.
Is it possible to move the Information to the right side ?Best Regards,
Sandy2503Sorry, for my bad english
-
- if you consider v1.1.x is sean version, so I did not have to make enough modification since v1.0.0 (like display OS, uptime, optimization) :(
- for your problem, i don’t know what do you really want… so try to adjust the css file
- you can try in real time modifing with dev console in Elements tab (npm start dev)
Hello! It looks like you're interested in this conversation, but you don't have an account yet.
Getting fed up of having to scroll through the same posts each visit? When you register for an account, you'll always come back to exactly where you were before, and choose to be notified of new replies (either via email, or push notification). You'll also be able to save bookmarks and upvote posts to show your appreciation to other community members.
With your input, this post could be even better 💗
Register Login