Read the statement by Michael Teeuw here.
has anyone used any of the charting tools, like chartjs?
-
i am making a module to add visualization of my friends water well system. I have a mobile app that does this, but it is hard to remember to look at the phone app…
anyhow, there is a rest api to get the raw measurements (collected at once a minute 24/7)…
for a 3 day view that is around 4200 entries.
-
Mmm rainfc uses jquery sparkline.
-
@cirdan thanks… trying to stay away from jquery… and the chartjs works fine with 5 or 10 points…
i have made some progress. the chart appears and has the right axis labels and values…
the chart itself is drawn wrong… with the jagged line across the x-axis at the right Y-axis height, being drawn vertically on the right edge of the chart, top to bottom…
-
@sdetweil not too fond of jquery too. Had to add labels in a creative way. But looks like you are on your way to a chartjs implementation. No experience with that. I would like to see the result though. Perhaps I can rewrite mmm-rainfc. Also when you get stuck, a svg solution is also an possibility…user spotyourdeal did a rewrite of the sparkline into svg for mmm-rainfc
-
@sdetweil Well well I was googling “chartjs” about the minute you wrote this down today! Ha! Great.
I’d like to use it to make some amendments to MMM-rain-forecast and maybe get in my own graph.
Have you seen MMM-chart, a MM cahrt template, which also seems to have examples of applications like yours.
I haven’t taken a close look into any of it but I’ll do soon.
Cheers and good luck! -
@lavolp3 said in has anyone used any of the charting tools, like chartjs?:
MMM-chart,
thanks… my data does not come back in JSON… but as CSV. with a unix milliseconds timestamp.
one data set is a float value (could be truncated to int), one is an int.
-
ok, well, this was user error…
while I had an array for time based points, ONE element in the array was JUST a single value.
this caused the charting tool to act weird…
fixing the one data point resolved the issue…
now, I want to change the color of the fill area under certain conditions (low reservoir, or constant running water) to alert about trouble to be resolved…looks like that is some custom extension i have to write…
-
here are some pics of the two charts
two charts upper right

two charts closer view

one chart

-
@sdetweil Looking good! How did you realize it? MMM-Chart? Chartjs and your own module?
-
@lavolp3 using chartjs and my own module. my data is not in JSON format required by MMM-Charts
here is the chartjs code
i have an structure, with arrays of points (by the sensor value), javascript Date, and value.
there are also arrays that contain the axis labels.make div for chart var c = document.createElement("div"); c.style.width=self.config.width+"px"; c.style.height=self.config.height+"px"; if(!self.config.stacked) c.style.display='inline-block'; self.wrapper.appendChild(c); canvas= document.createElement("canvas"); canvas.id="myChart"+this_pin; c.appendChild(canvas); for(var pin_index=0; pin_index < self.config.Pins.length; (how do you do less than in markup?, space after < ) pin_index++) { var this_pin=self.config.Pins[pin_index]; self.charts[pin_index] = new Chart(canvas, { type: 'line', showLine: true, data: { datasets: [ { xAxisID: 'dates', data: self.data[this_pin], fill:true, borderColor: '#2196f3', backgroundColor: '#2196f3', }, ] }, options: { legend: { display: false}, tooltips: { enabled: false, displayColors: false }, responsive: false, elements: { point: { radius: 0 }, line: { tension: 0, // disables bezier curves } }, scales: { xAxes: [{ id: 'dates', type: 'time', distribution: 'linear', scaleLabel: { display: true, labelString: self.config.labels[pin_index]+" - last "+self.config.dayrange+" days", fontColor: 'white' }, gridLines: { display: false, zeroLineColor: '#ffcc33' }, time: { unit: 'minute' }, bounds: 'data', ticks: { display: false , maxRotation: 90, source: 'data', maxTicksLimit: self.data[this_pin].length, }, }], yAxes: [{ display: true, scaleLabel: { display: true, labelString: self.config.yaxis_legend[pin_index], fontColor: 'white' }, gridLines: { display: true, color: "#FFFFFF", zeroLineColor: '#ffcc33', fontColor: 'white', scaleFontColor: 'white', }, ticks: { beginAtZero: true, source: 'data', min: 0, fontColor: 'white' }, }] }, } }); } -
@sdetweil Thanks for sharing!!
I’ll try that out with the rain-forecast module -
@lavolp3 i have over 4000 measurements in each chart. (3 days, once a minute)
still pretty reasonable performance.
update once every 5 minutes, or when come back from sleeping (no updates while MM is asleep).
-
I have updated the code now to improve performance…
- reduce number of data points, by decimation (using 1 point of every 5) to get to 800 points. See info once every 5th minutes, vs once a minute
- build 800 point data from in memory CSV (api sends back csv data) by looking from NOW (end) til previous (backwards) which reduces the number of lines of data processed from 14000 to 4000 (configurable number of days for chart)
- create a color gradient table start-end: color, start-end:color2… to draw multiple colors on chart, as part of the data selection in 1 and 2 above… this make the processor O(1) (single pass), instead of O(4)
performance is much improved…
prior, 4000 points, elapsed time for 2 charts, 39 seconds. now 3.5 seconds (odroid). pi crashed with 4000 points at 4 minutes elapsed… now just about 4.5 seconds -
I have no idea what you just said but I upvoted your post anyway. :-)
-
no i never use charting tool what is the function of that tool???
-
@tarun well… basically to create charts from data …
-
I have now used chartjs as well on the MMM-rain-forecast module by @cirdan and SpoturDeal.
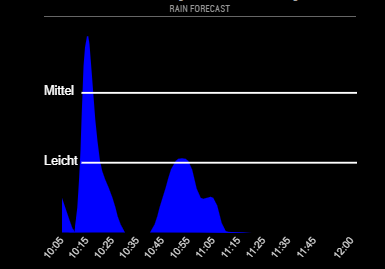
I like it and there are some plugins to use as well.
First results can be achieved very quickly, but if you want to change further specific things, it’s getting difficult with the various objects.@sdetweil do you know of a complete set of options for chartjs? I find the documentation a bit too short and confusing.
-
@lavolp3 i do not… there are tons of options, which I guess you would expect.
Hello! It looks like you're interested in this conversation, but you don't have an account yet.
Getting fed up of having to scroll through the same posts each visit? When you register for an account, you'll always come back to exactly where you were before, and choose to be notified of new replies (either via email, or push notification). You'll also be able to save bookmarks and upvote posts to show your appreciation to other community members.
With your input, this post could be even better 💗
Register Login